
6
More Annotations


2


4
Favourite Annotations


1


2
Text
AMELIA WATTENBERGERTHINKING IN REACT HOOKSPODCASTS I'VE BEEN ONSCALING SVG ELEMENTSCHECK IT OUT Amelia Wattenberger. I write code, think about data, and create digital experiences. Currently Staff Research Engineer doing R&D on developer experience on the Github Office of the CTO team. Listen to podcasts I've been on, or read articles I've written.
AMELIA WATTENBERGER
Amelia Wattenberger - Senior Journalist-Engineer at Polygraph/The Pudding. January 5th, 2021. I reached out to David to tell him how much I was enjoying listening to his podcast, and he was kind enough to invite me on. We had a great chat about ways to make yourself standAMELIA WATTENBERGER
Daily number of boats fishing in foreign waters (2016) Fish taken fromFrance’s waters
AMELIA WATTENBERGER
Combining React and D3. When I visualize data on the web, my current favorite environment is using D3.js inside of a React.js application. These two technologies are notoriously tricky to combine. Here's my opinionated guide to living with both, in harmony.AMELIA WATTENBERGER
Data Visualization Society. Over the past few weeks, 3,500 people have signed up for an invite to the Data Visualization Society to discuss, envision, and engage. Explore their expertise and location (log scaled and converted to polar coordinates) relative to you. Top skill. society. visualization. data.AMELIA WATTENBERGER
While it might seem like D3.js is an all-encompassing framework, it’s really just a collection of small modules. Here are all of the modules: each is visualized as a circle - larger circles are modules with larger file sizes. Wow! This is really overwhelming to see all of these packages at once. Let's talk about specific modules, grouped byAMELIA WATTENBERGER
At the end of this journey, we'll have created a gauge component in React.js. A gauge is a simple diagram that visualizes a simple number. The shape and design is based on physical gauges, used in control panels to show the measurement of a specific metric. I like to use them in digital interfaces to show context around a number -- a usercan
AMELIA WATTENBERGER
The CSS Cascade Or, How browsers resolve competing CSS styles. We style our websites using CSS, which stands for Cascading Style Sheets. But what does Cascading really mean?. The CSS Cascade is one of the most powerful parts of CSS.AMELIA WATTENBERGER
Thinking in React Hooks. React introduced hooks one year ago, and they've been a game-changer for a lot of developers. There are tons of how-to introduction resources out there, but I want to talk about the fundamental mindset change when switching from React class components to function components + hooks. Class component.AMELIA WATTENBERGER
Go home Ask me anything on Twitter Learn how to make amazing datavisualizations RSS
AMELIA WATTENBERGERTHINKING IN REACT HOOKSPODCASTS I'VE BEEN ONSCALING SVG ELEMENTSCHECK IT OUT Amelia Wattenberger. I write code, think about data, and create digital experiences. Currently Staff Research Engineer doing R&D on developer experience on the Github Office of the CTO team. Listen to podcasts I've been on, or read articles I've written.AMELIA WATTENBERGER
Amelia Wattenberger - Senior Journalist-Engineer at Polygraph/The Pudding. January 5th, 2021. I reached out to David to tell him how much I was enjoying listening to his podcast, and he was kind enough to invite me on. We had a great chat about ways to make yourself standAMELIA WATTENBERGER
Daily number of boats fishing in foreign waters (2016) Fish taken fromFrance’s waters
AMELIA WATTENBERGER
Combining React and D3. When I visualize data on the web, my current favorite environment is using D3.js inside of a React.js application. These two technologies are notoriously tricky to combine. Here's my opinionated guide to living with both, in harmony.AMELIA WATTENBERGER
Data Visualization Society. Over the past few weeks, 3,500 people have signed up for an invite to the Data Visualization Society to discuss, envision, and engage. Explore their expertise and location (log scaled and converted to polar coordinates) relative to you. Top skill. society. visualization. data.AMELIA WATTENBERGER
While it might seem like D3.js is an all-encompassing framework, it’s really just a collection of small modules. Here are all of the modules: each is visualized as a circle - larger circles are modules with larger file sizes. Wow! This is really overwhelming to see all of these packages at once. Let's talk about specific modules, grouped byAMELIA WATTENBERGER
At the end of this journey, we'll have created a gauge component in React.js. A gauge is a simple diagram that visualizes a simple number. The shape and design is based on physical gauges, used in control panels to show the measurement of a specific metric. I like to use them in digital interfaces to show context around a number -- a usercan
AMELIA WATTENBERGER
The CSS Cascade Or, How browsers resolve competing CSS styles. We style our websites using CSS, which stands for Cascading Style Sheets. But what does Cascading really mean?. The CSS Cascade is one of the most powerful parts of CSS.AMELIA WATTENBERGER
Thinking in React Hooks. React introduced hooks one year ago, and they've been a game-changer for a lot of developers. There are tons of how-to introduction resources out there, but I want to talk about the fundamental mindset change when switching from React class components to function components + hooks. Class component.AMELIA WATTENBERGER
Go home Ask me anything on Twitter Learn how to make amazing datavisualizations RSS
AMELIA WATTENBERGER
Daily number of boats fishing in foreign waters (2016) Fish taken fromFrance’s waters
AMELIA WATTENBERGER
Using 2016 dog licensing data from NYC Open data and dog intelligence data from Stanley Coren, parsed and uploaded to Data WorldAMELIA WATTENBERGER
Scaling s can be a daunting task, since they act very differently than normal images.Instead of thinking of s as images, let's change our mindset:. The element is a telescope into another world.. Much like everything inside of an on another webpage, everything inside of an element is in another world.. Our telescope defaults to a normal zoom level: one "unit" isAMELIA WATTENBERGER
Photoronoi. Upload an image or grab from a url to turn an image into a voronoi SVG. Darker parts of the image result in smaller polygons - play around with the settings to see what works best for your picture!AMELIA WATTENBERGER
Filter out articles containing strings: Select Showing 0 of 0 articlesAMELIA WATTENBERGER
Go home Ask me anything on Twitter Learn how to make amazing datavisualizations RSS
AMELIA WATTENBERGER
Clone the exercise repo at: github.com/Wattenberger/svg-workshop. Wattenberger. ThoughtsAMELIA WATTENBERGER
Thanks for signing up! I'll be sending you updates on any blogs posts I'm working on, data visualization experiments, and frontend development & design tutorials. Or play with this interactive map of country similarity from this article.AMELIA WATTENBERGER
You need to enable JavaScript to run this app. Amelia Wattenberger. You need to enable JavaScript to run this app.AMELIA WATTENBERGER
One of the CSS units I use most is the wonderful % — so handy for positioning elements on the page. Unfortunately, the rules aren’t exactly straightforward. One question I’m always asking myself is: Percent of what? What does 100% mean in CSS? AMELIA WATTENBERGERTHINKING IN REACT HOOKSPODCASTS I'VE BEEN ONSCALING SVG ELEMENTSCHECK IT OUT Amelia Wattenberger. I write code, think about data, and create digital experiences. Currently Staff Research Engineer doing R&D on developer experience on the Github Office of the CTO team. Listen to podcasts I've been on, or read articles I've written.AMELIA WATTENBERGER
Amelia Wattenberger - Senior Journalist-Engineer at Polygraph/The Pudding. January 5th, 2021. I reached out to David to tell him how much I was enjoying listening to his podcast, and he was kind enough to invite me on. We had a great chat about ways to make yourself standAMELIA WATTENBERGER
Combining React and D3. When I visualize data on the web, my current favorite environment is using D3.js inside of a React.js application. These two technologies are notoriously tricky to combine. Here's my opinionated guide to living with both, in harmony.AMELIA WATTENBERGER
Data Visualization Society. Over the past few weeks, 3,500 people have signed up for an invite to the Data Visualization Society to discuss, envision, and engage. Explore their expertise and location (log scaled and converted to polar coordinates) relative to you. Top skill. society. visualization. data.AMELIA WATTENBERGER
At the end of this journey, we'll have created a gauge component in React.js. A gauge is a simple diagram that visualizes a simple number. The shape and design is based on physical gauges, used in control panels to show the measurement of a specific metric. I like to use them in digital interfaces to show context around a number -- a usercan
AMELIA WATTENBERGER
While it might seem like D3.js is an all-encompassing framework, it’s really just a collection of small modules. Here are all of the modules: each is visualized as a circle - larger circles are modules with larger file sizes. Wow! This is really overwhelming to see all of these packages at once. Let's talk about specific modules, grouped byAMELIA WATTENBERGER
The CSS Cascade Or, How browsers resolve competing CSS styles. We style our websites using CSS, which stands for Cascading Style Sheets. But what does Cascading really mean?. The CSS Cascade is one of the most powerful parts of CSS.AMELIA WATTENBERGER
The x force. There are several built-in forces that we can use with a d3-force simulation. The first I'll teach you is the x force. The x force urges our particles to move towards a specific x (horizontal) position. Add new x forces (in the Simulation Control Panel) to our active forces, and move the sliders to change the targeted x position.AMELIA WATTENBERGER
Thinking in React Hooks. React introduced hooks one year ago, and they've been a game-changer for a lot of developers. There are tons of how-to introduction resources out there, but I want to talk about the fundamental mindset change when switching from React class components to function components + hooks. Class component.AMELIA WATTENBERGER
Go home Ask me anything on Twitter Learn how to make amazing datavisualizations RSS
AMELIA WATTENBERGERTHINKING IN REACT HOOKSPODCASTS I'VE BEEN ONSCALING SVG ELEMENTSCHECK IT OUT Amelia Wattenberger. I write code, think about data, and create digital experiences. Currently Staff Research Engineer doing R&D on developer experience on the Github Office of the CTO team. Listen to podcasts I've been on, or read articles I've written.AMELIA WATTENBERGER
Amelia Wattenberger - Senior Journalist-Engineer at Polygraph/The Pudding. January 5th, 2021. I reached out to David to tell him how much I was enjoying listening to his podcast, and he was kind enough to invite me on. We had a great chat about ways to make yourself standAMELIA WATTENBERGER
Combining React and D3. When I visualize data on the web, my current favorite environment is using D3.js inside of a React.js application. These two technologies are notoriously tricky to combine. Here's my opinionated guide to living with both, in harmony.AMELIA WATTENBERGER
Data Visualization Society. Over the past few weeks, 3,500 people have signed up for an invite to the Data Visualization Society to discuss, envision, and engage. Explore their expertise and location (log scaled and converted to polar coordinates) relative to you. Top skill. society. visualization. data.AMELIA WATTENBERGER
At the end of this journey, we'll have created a gauge component in React.js. A gauge is a simple diagram that visualizes a simple number. The shape and design is based on physical gauges, used in control panels to show the measurement of a specific metric. I like to use them in digital interfaces to show context around a number -- a usercan
AMELIA WATTENBERGER
While it might seem like D3.js is an all-encompassing framework, it’s really just a collection of small modules. Here are all of the modules: each is visualized as a circle - larger circles are modules with larger file sizes. Wow! This is really overwhelming to see all of these packages at once. Let's talk about specific modules, grouped byAMELIA WATTENBERGER
The CSS Cascade Or, How browsers resolve competing CSS styles. We style our websites using CSS, which stands for Cascading Style Sheets. But what does Cascading really mean?. The CSS Cascade is one of the most powerful parts of CSS.AMELIA WATTENBERGER
The x force. There are several built-in forces that we can use with a d3-force simulation. The first I'll teach you is the x force. The x force urges our particles to move towards a specific x (horizontal) position. Add new x forces (in the Simulation Control Panel) to our active forces, and move the sliders to change the targeted x position.AMELIA WATTENBERGER
Thinking in React Hooks. React introduced hooks one year ago, and they've been a game-changer for a lot of developers. There are tons of how-to introduction resources out there, but I want to talk about the fundamental mindset change when switching from React class components to function components + hooks. Class component.AMELIA WATTENBERGER
Go home Ask me anything on Twitter Learn how to make amazing datavisualizations RSS
AMELIA WATTENBERGER
Amelia Wattenberger - Senior Journalist-Engineer at Polygraph/The Pudding. January 5th, 2021. I reached out to David to tell him how much I was enjoying listening to his podcast, and he was kind enough to invite me on. We had a great chat about ways to make yourself standAMELIA WATTENBERGER
Using 2016 dog licensing data from NYC Open data and dog intelligence data from Stanley Coren, parsed and uploaded to Data WorldAMELIA WATTENBERGER
Photoronoi. Upload an image or grab from a url to turn an image into a voronoi SVG. Darker parts of the image result in smaller polygons - play around with the settings to see what works best for your picture!AMELIA WATTENBERGER
One of the most enjoyable parts of the d3.js API is the d3-force module. Using d3-force, we can create a force simulation that gives life to basic particles, moving them according to basic physical rules. For example, say we have an array of 100 points at . Let's visualize them all! Hmm, that was a little underwhelming, wasn'tit?
AMELIA WATTENBERGER
Filter out articles containing strings: Select Showing 0 of 0 articlesAMELIA WATTENBERGER
Go home Ask me anything on Twitter Learn how to make amazing datavisualizations RSS
AMELIA WATTENBERGER
You need to enable JavaScript to run this app. Amelia Wattenberger. You need to enable JavaScript to run this app.AMELIA WATTENBERGER
Clone the exercise repo at: github.com/Wattenberger/svg-workshop. Wattenberger. ThoughtsAMELIA WATTENBERGER
Thanks for signing up! I'll be sending you updates on any blogs posts I'm working on, data visualization experiments, and frontend development & design tutorials. Or play with this interactive map of country similarity from this article.AMELIA WATTENBERGER
One of the CSS units I use most is the wonderful % — so handy for positioning elements on the page. Unfortunately, the rules aren’t exactly straightforward. One question I’m always asking myself is: Percent of what? What does 100% mean in CSS? AMELIA WATTENBERGERTHINKING IN REACT HOOKSPODCASTS I'VE BEEN ONSCALING SVG ELEMENTSCHECK IT OUT Amelia Wattenberger. I write code, think about data, and create digital experiences. Currently Staff Research Engineer doing R&D on developer experience on the Github Office of the CTO team. Listen to podcasts I've been on, or read articles I've written.AMELIA WATTENBERGER
Amelia Wattenberger - Senior Journalist-Engineer at Polygraph/The Pudding. January 5th, 2021. I reached out to David to tell him how much I was enjoying listening to his podcast, and he was kind enough to invite me on. We had a great chat about ways to make yourself standAMELIA WATTENBERGER
Data Visualization Society. Over the past few weeks, 3,500 people have signed up for an invite to the Data Visualization Society to discuss, envision, and engage. Explore their expertise and location (log scaled and converted to polar coordinates) relative to you. Top skill. society. visualization. data.AMELIA WATTENBERGER
Photoronoi. Upload an image or grab from a url to turn an image into a voronoi SVG. Darker parts of the image result in smaller polygons - play around with the settings to see what works best for your picture!AMELIA WATTENBERGER
At the end of this journey, we'll have created a gauge component in React.js. A gauge is a simple diagram that visualizes a simple number. The shape and design is based on physical gauges, used in control panels to show the measurement of a specific metric. I like to use them in digital interfaces to show context around a number -- a usercan
AMELIA WATTENBERGERD3 JS GALLERYD3 JS PYTHOND3 JS EXAMPLESD3 JS TUTORIAL PDFD3 JS CHARTD3 NETWORK GRAPH EXAMPLE While it might seem like D3.js is an all-encompassing framework, it’s really just a collection of small modules. Here are all of the modules: each is visualized as a circle - larger circles are modules with larger file sizes. Wow! This is really overwhelming to see all of these packages at once. Let's talk about specific modules, grouped byAMELIA WATTENBERGER
The CSS Cascade Or, How browsers resolve competing CSS styles. We style our websites using CSS, which stands for Cascading Style Sheets. But what does Cascading really mean?. The CSS Cascade is one of the most powerful parts of CSS.AMELIA WATTENBERGER
The x force. There are several built-in forces that we can use with a d3-force simulation. The first I'll teach you is the x force. The x force urges our particles to move towards a specific x (horizontal) position. Add new x forces (in the Simulation Control Panel) to our active forces, and move the sliders to change the targeted x position. AMELIA WATTENBERGERTHINKING IN REACT HOOKSBEST REACT COMPONENTSNORMAN WATTENBERGERREACT HOOKS PREVSTATEREACT VIEW MODELREACT WEBARCHITECTURE
Thinking in React Hooks. React introduced hooks one year ago, and they've been a game-changer for a lot of developers. There are tons of how-to introduction resources out there, but I want to talk about the fundamental mindset change when switching from React class components to function components + hooks. Class component.AMELIA WATTENBERGER
Go home Ask me anything on Twitter Learn how to make amazing datavisualizations RSS
AMELIA WATTENBERGERTHINKING IN REACT HOOKSPODCASTS I'VE BEEN ONSCALING SVG ELEMENTSCHECK IT OUT Amelia Wattenberger. I write code, think about data, and create digital experiences. Currently Staff Research Engineer doing R&D on developer experience on the Github Office of the CTO team. Listen to podcasts I've been on, or read articles I've written.AMELIA WATTENBERGER
Amelia Wattenberger - Senior Journalist-Engineer at Polygraph/The Pudding. January 5th, 2021. I reached out to David to tell him how much I was enjoying listening to his podcast, and he was kind enough to invite me on. We had a great chat about ways to make yourself standAMELIA WATTENBERGER
Data Visualization Society. Over the past few weeks, 3,500 people have signed up for an invite to the Data Visualization Society to discuss, envision, and engage. Explore their expertise and location (log scaled and converted to polar coordinates) relative to you. Top skill. society. visualization. data.AMELIA WATTENBERGER
Photoronoi. Upload an image or grab from a url to turn an image into a voronoi SVG. Darker parts of the image result in smaller polygons - play around with the settings to see what works best for your picture!AMELIA WATTENBERGER
At the end of this journey, we'll have created a gauge component in React.js. A gauge is a simple diagram that visualizes a simple number. The shape and design is based on physical gauges, used in control panels to show the measurement of a specific metric. I like to use them in digital interfaces to show context around a number -- a usercan
AMELIA WATTENBERGERD3 JS GALLERYD3 JS PYTHOND3 JS EXAMPLESD3 JS TUTORIAL PDFD3 JS CHARTD3 NETWORK GRAPH EXAMPLE While it might seem like D3.js is an all-encompassing framework, it’s really just a collection of small modules. Here are all of the modules: each is visualized as a circle - larger circles are modules with larger file sizes. Wow! This is really overwhelming to see all of these packages at once. Let's talk about specific modules, grouped byAMELIA WATTENBERGER
The CSS Cascade Or, How browsers resolve competing CSS styles. We style our websites using CSS, which stands for Cascading Style Sheets. But what does Cascading really mean?. The CSS Cascade is one of the most powerful parts of CSS.AMELIA WATTENBERGER
The x force. There are several built-in forces that we can use with a d3-force simulation. The first I'll teach you is the x force. The x force urges our particles to move towards a specific x (horizontal) position. Add new x forces (in the Simulation Control Panel) to our active forces, and move the sliders to change the targeted x position. AMELIA WATTENBERGERTHINKING IN REACT HOOKSBEST REACT COMPONENTSNORMAN WATTENBERGERREACT HOOKS PREVSTATEREACT VIEW MODELREACT WEBARCHITECTURE
Thinking in React Hooks. React introduced hooks one year ago, and they've been a game-changer for a lot of developers. There are tons of how-to introduction resources out there, but I want to talk about the fundamental mindset change when switching from React class components to function components + hooks. Class component.AMELIA WATTENBERGER
Go home Ask me anything on Twitter Learn how to make amazing datavisualizations RSS
AMELIA WATTENBERGER
Amelia Wattenberger - Senior Journalist-Engineer at Polygraph/The Pudding. January 5th, 2021. I reached out to David to tell him how much I was enjoying listening to his podcast, and he was kind enough to invite me on. We had a great chat about ways to make yourself standAMELIA WATTENBERGER
Go home Ask me anything on Twitter Learn how to make amazing datavisualizations RSS
AMELIA WATTENBERGER
Using 2016 dog licensing data from NYC Open data and dog intelligence data from Stanley Coren, parsed and uploaded to Data WorldAMELIA WATTENBERGER
Combining React and D3. When I visualize data on the web, my current favorite environment is using D3.js inside of a React.js application. These two technologies are notoriously tricky to combine. Here's my opinionated guide to living with both, in harmony.AMELIA WATTENBERGER
Filter out articles containing strings: Select Showing 0 of 0 articlesAMELIA WATTENBERGER
Clone the exercise repo at: github.com/Wattenberger/svg-workshop. Wattenberger. ThoughtsAMELIA WATTENBERGER
One of the CSS units I use most is the wonderful % — so handy for positioning elements on the page. Unfortunately, the rules aren’t exactly straightforward. One question I’m always asking myself is: Percent of what? What does 100% mean in CSS?AMELIA WATTENBERGER
You need to enable JavaScript to run this app. Amelia Wattenberger. You need to enable JavaScript to run this app.AMELIA WATTENBERGER
One of the most enjoyable parts of the d3.js API is the d3-force module. Using d3-force, we can create a force simulation that gives life to basic particles, moving them according to basic physical rules. For example, say we have an array of 100 points at . Let's visualize them all! Hmm, that was a little underwhelming, wasn'tit?
AMELIA WATTENBERGERTHINKING IN REACT HOOKSPODCASTS I'VE BEEN ONSCALING SVG ELEMENTSCHECK IT OUT Amelia Wattenberger. I write code, think about data, and create digital experiences. Currently Staff Research Engineer doing R&D on developer experience on the Github Office of the CTO team. Listen to podcasts I've been on, or read articles I've written.AMELIA WATTENBERGER
Amelia Wattenberger - Senior Journalist-Engineer at Polygraph/The Pudding. January 5th, 2021. I reached out to David to tell him how much I was enjoying listening to his podcast, and he was kind enough to invite me on. We had a great chat about ways to make yourself standAMELIA WATTENBERGER
Data Visualization Society. Over the past few weeks, 3,500 people have signed up for an invite to the Data Visualization Society to discuss, envision, and engage. Explore their expertise and location (log scaled and converted to polar coordinates) relative to you. Top skill. society. visualization. data.AMELIA WATTENBERGER
Photoronoi. Upload an image or grab from a url to turn an image into a voronoi SVG. Darker parts of the image result in smaller polygons - play around with the settings to see what works best for your picture!AMELIA WATTENBERGER
At the end of this journey, we'll have created a gauge component in React.js. A gauge is a simple diagram that visualizes a simple number. The shape and design is based on physical gauges, used in control panels to show the measurement of a specific metric. I like to use them in digital interfaces to show context around a number -- a usercan
AMELIA WATTENBERGERD3 JS GALLERYD3 JS PYTHOND3 JS EXAMPLESD3 JS TUTORIAL PDFD3 JS CHARTD3 NETWORK GRAPH EXAMPLE While it might seem like D3.js is an all-encompassing framework, it’s really just a collection of small modules. Here are all of the modules: each is visualized as a circle - larger circles are modules with larger file sizes. Wow! This is really overwhelming to see all of these packages at once. Let's talk about specific modules, grouped byAMELIA WATTENBERGER
The CSS Cascade Or, How browsers resolve competing CSS styles. We style our websites using CSS, which stands for Cascading Style Sheets. But what does Cascading really mean?. The CSS Cascade is one of the most powerful parts of CSS.AMELIA WATTENBERGER
The x force. There are several built-in forces that we can use with a d3-force simulation. The first I'll teach you is the x force. The x force urges our particles to move towards a specific x (horizontal) position. Add new x forces (in the Simulation Control Panel) to our active forces, and move the sliders to change the targeted x position. AMELIA WATTENBERGERTHINKING IN REACT HOOKSBEST REACT COMPONENTSNORMAN WATTENBERGERREACT HOOKS PREVSTATEREACT VIEW MODELREACT WEBARCHITECTURE
Thinking in React Hooks. React introduced hooks one year ago, and they've been a game-changer for a lot of developers. There are tons of how-to introduction resources out there, but I want to talk about the fundamental mindset change when switching from React class components to function components + hooks. Class component.AMELIA WATTENBERGER
Go home Ask me anything on Twitter Learn how to make amazing datavisualizations RSS
AMELIA WATTENBERGER
Amelia Wattenberger - Senior Journalist-Engineer at Polygraph/The Pudding. January 5th, 2021. I reached out to David to tell him how much I was enjoying listening to his podcast, and he was kind enough to invite me on. We had a great chat about ways to make yourself standAMELIA WATTENBERGER
Go home Ask me anything on Twitter Learn how to make amazing datavisualizations RSS
AMELIA WATTENBERGER
Using 2016 dog licensing data from NYC Open data and dog intelligence data from Stanley Coren, parsed and uploaded to Data WorldAMELIA WATTENBERGER
Combining React and D3. When I visualize data on the web, my current favorite environment is using D3.js inside of a React.js application. These two technologies are notoriously tricky to combine. Here's my opinionated guide to living with both, in harmony.AMELIA WATTENBERGER
Filter out articles containing strings: Select Showing 0 of 0 articlesAMELIA WATTENBERGER
Clone the exercise repo at: github.com/Wattenberger/svg-workshop. Wattenberger. ThoughtsAMELIA WATTENBERGER
One of the CSS units I use most is the wonderful % — so handy for positioning elements on the page. Unfortunately, the rules aren’t exactly straightforward. One question I’m always asking myself is: Percent of what? What does 100% mean in CSS?AMELIA WATTENBERGER
You need to enable JavaScript to run this app. Amelia Wattenberger. You need to enable JavaScript to run this app.AMELIA WATTENBERGER
One of the most enjoyable parts of the d3.js API is the d3-force module. Using d3-force, we can create a force simulation that gives life to basic particles, moving them according to basic physical rules. For example, say we have an array of 100 points at . Let's visualize them all! Hmm, that was a little underwhelming, wasn'tit?
AMELIA WATTENBERGERTHINKING IN REACT HOOKSPODCASTS I'VE BEEN ONSCALING SVG ELEMENTSCHECK IT OUT D3.js is the de facto library for drawing data visualization on the web. Unless you are very intimately familiar with the API, you probably view it as a monolithic framework, and make charts by copy + pasting code from bl.ocks.AMELIA WATTENBERGER
I'm a huge fan of the PolicyViz Podcast with Jon Schwabish — he always has great guests, a relaxed vibe, and asks great questions. In this episode, we chat about Fullstack D3 and Data Visualization, developing data viz in the browser, and a really fun augmented reality project I worked on.AMELIA WATTENBERGER
What does 100% mean in CSS? One of the CSS units I use most is the wonderful % — so handy for positioning elements on the page. Unfortunately, the rules aren’t exactly straightforward. One question I’m always asking myself is: Percent of what? Read moreAMELIA WATTENBERGER
Over the past few weeks, 3,500 people have signed up for an invite to the Data Visualization Society to discuss, envision, and engage. Explore their expertise and location (log scaled and converted to polar coordinates) relative to you.AMELIA WATTENBERGER
Unfamiliar with the unit em? em is a CSS unit that scales with the font-size.Read more on the MDN docs.. We can think about the element as a telescope into another world.Our telescope defaults to a normal zoom level: one unit is the same as one pixel.AMELIA WATTENBERGER
Photoronoi. Upload an image or grab from a url to turn an image into a voronoi SVG. Darker parts of the image result in smaller polygons - play around with the settings to see what works best for your picture! AMELIA WATTENBERGERD3 JS GALLERYD3 JS PYTHOND3 JS EXAMPLESD3 JS TUTORIAL PDFD3 JS CHARTD3 NETWORK GRAPH EXAMPLE So, you want to create amazing data visualizations on the web and you keep hearing about D3.js. But what is D3.js, and how can you learn it? Let’s start with the question: What is D3? While it might seem like D3.js is an all-encompassing framework, it’s really just a collection of small modules.AMELIA WATTENBERGER
The CSS Cascade Or, How browsers resolve competing CSS styles. We style our websites using CSS, which stands for Cascading Style Sheets. But what does Cascading really mean?. The CSS Cascade is one of the most powerful parts of CSS. AMELIA WATTENBERGERTHINKING IN REACT HOOKSBEST REACT COMPONENTSNORMAN WATTENBERGERREACT HOOKS PREVSTATEREACT VIEW MODELREACT WEBARCHITECTURE
React introduced hooks one year ago, and they've been a game-changer for a lot of developers. There are tons of how-to introduction resources out there, but I want to talk about the fundamental mindset change when switching from React class components to functioncomponents + hooks.
AMELIA WATTENBERGER
Go home Ask me anything on Twitter Learn how to make amazing datavisualizations RSS
AMELIA WATTENBERGERTHINKING IN REACT HOOKSPODCASTS I'VE BEEN ONSCALING SVG ELEMENTSCHECK IT OUT Amelia Wattenberger. I write code, think about data, and create digital experiences. Currently Staff Research Engineer doing R&D on developer experience on the Github Office of the CTO team. Listen to podcasts I've been on, or read articles I've written.AMELIA WATTENBERGER
Amelia Wattenberger - Senior Journalist-Engineer at Polygraph/The Pudding. January 5th, 2021. I reached out to David to tell him how much I was enjoying listening to his podcast, and he was kind enough to invite me on. We had a great chat about ways to make yourself standAMELIA WATTENBERGER
Data Visualization Society. Over the past few weeks, 3,500 people have signed up for an invite to the Data Visualization Society to discuss, envision, and engage. Explore their expertise and location (log scaled and converted to polar coordinates) relative to you. Top skill. society. visualization. data.AMELIA WATTENBERGER
Photoronoi. Upload an image or grab from a url to turn an image into a voronoi SVG. Darker parts of the image result in smaller polygons - play around with the settings to see what works best for your picture!AMELIA WATTENBERGER
At the end of this journey, we'll have created a gauge component in React.js. A gauge is a simple diagram that visualizes a simple number. The shape and design is based on physical gauges, used in control panels to show the measurement of a specific metric. I like to use them in digital interfaces to show context around a number -- a usercan
AMELIA WATTENBERGERD3 JS GALLERYD3 JS PYTHOND3 JS EXAMPLESD3 JS TUTORIAL PDFD3 JS CHARTD3 NETWORK GRAPH EXAMPLE While it might seem like D3.js is an all-encompassing framework, it’s really just a collection of small modules. Here are all of the modules: each is visualized as a circle - larger circles are modules with larger file sizes. Wow! This is really overwhelming to see all of these packages at once. Let's talk about specific modules, grouped byAMELIA WATTENBERGER
The CSS Cascade Or, How browsers resolve competing CSS styles. We style our websites using CSS, which stands for Cascading Style Sheets. But what does Cascading really mean?. The CSS Cascade is one of the most powerful parts of CSS.AMELIA WATTENBERGER
The x force. There are several built-in forces that we can use with a d3-force simulation. The first I'll teach you is the x force. The x force urges our particles to move towards a specific x (horizontal) position. Add new x forces (in the Simulation Control Panel) to our active forces, and move the sliders to change the targeted x position. AMELIA WATTENBERGERTHINKING IN REACT HOOKSBEST REACT COMPONENTSNORMAN WATTENBERGERREACT HOOKS PREVSTATEREACT VIEW MODELREACT WEBARCHITECTURE
Thinking in React Hooks. React introduced hooks one year ago, and they've been a game-changer for a lot of developers. There are tons of how-to introduction resources out there, but I want to talk about the fundamental mindset change when switching from React class components to function components + hooks. Class component.AMELIA WATTENBERGER
Go home Ask me anything on Twitter Learn how to make amazing datavisualizations RSS
AMELIA WATTENBERGER
Amelia Wattenberger - Senior Journalist-Engineer at Polygraph/The Pudding. January 5th, 2021. I reached out to David to tell him how much I was enjoying listening to his podcast, and he was kind enough to invite me on. We had a great chat about ways to make yourself standAMELIA WATTENBERGER
Combining React and D3. When I visualize data on the web, my current favorite environment is using D3.js inside of a React.js application. These two technologies are notoriously tricky to combine. Here's my opinionated guide to living with both, in harmony.AMELIA WATTENBERGER
Using 2016 dog licensing data from NYC Open data and dog intelligence data from Stanley Coren, parsed and uploaded to Data WorldAMELIA WATTENBERGER
Go home Ask me anything on Twitter Learn how to make amazing datavisualizations RSS
AMELIA WATTENBERGER
Filter out articles containing strings: Select Showing 0 of 0 articlesAMELIA WATTENBERGER
One of the most enjoyable parts of the d3.js API is the d3-force module. Using d3-force, we can create a force simulation that gives life to basic particles, moving them according to basic physical rules. For example, say we have an array of 100 points at . Let's visualize them all! Hmm, that was a little underwhelming, wasn'tit?
AMELIA WATTENBERGER
Thanks for signing up! I'll be sending you updates on any blogs posts I'm working on, data visualization experiments, and frontend development & design tutorials. Or play with this interactive map of country similarity from this article.AMELIA WATTENBERGER
You need to enable JavaScript to run this app. Amelia Wattenberger. You need to enable JavaScript to run this app.AMELIA WATTENBERGER
Clone the exercise repo at: github.com/Wattenberger/svg-workshop. Wattenberger. ThoughtsAMELIA WATTENBERGER
One of the CSS units I use most is the wonderful % — so handy for positioning elements on the page. Unfortunately, the rules aren’t exactly straightforward. One question I’m always asking myself is: Percent of what? What does 100% mean in CSS? AMELIA WATTENBERGERTHINKING IN REACT HOOKSPODCASTS I'VE BEEN ONSCALING SVG ELEMENTSCHECK IT OUT D3.js is the de facto library for drawing data visualization on the web. Unless you are very intimately familiar with the API, you probably view it as a monolithic framework, and make charts by copy + pasting code from bl.ocks.AMELIA WATTENBERGER
I'm a huge fan of the PolicyViz Podcast with Jon Schwabish — he always has great guests, a relaxed vibe, and asks great questions. In this episode, we chat about Fullstack D3 and Data Visualization, developing data viz in the browser, and a really fun augmented reality project I worked on.AMELIA WATTENBERGER
What does 100% mean in CSS? One of the CSS units I use most is the wonderful % — so handy for positioning elements on the page. Unfortunately, the rules aren’t exactly straightforward. One question I’m always asking myself is: Percent of what? Read moreAMELIA WATTENBERGER
Over the past few weeks, 3,500 people have signed up for an invite to the Data Visualization Society to discuss, envision, and engage. Explore their expertise and location (log scaled and converted to polar coordinates) relative to you.AMELIA WATTENBERGER
Unfamiliar with the unit em? em is a CSS unit that scales with the font-size.Read more on the MDN docs.. We can think about the element as a telescope into another world.Our telescope defaults to a normal zoom level: one unit is the same as one pixel.AMELIA WATTENBERGER
Photoronoi. Upload an image or grab from a url to turn an image into a voronoi SVG. Darker parts of the image result in smaller polygons - play around with the settings to see what works best for your picture! AMELIA WATTENBERGERD3 JS GALLERYD3 JS PYTHOND3 JS EXAMPLESD3 JS TUTORIAL PDFD3 JS CHARTD3 NETWORK GRAPH EXAMPLE So, you want to create amazing data visualizations on the web and you keep hearing about D3.js. But what is D3.js, and how can you learn it? Let’s start with the question: What is D3? While it might seem like D3.js is an all-encompassing framework, it’s really just a collection of small modules.AMELIA WATTENBERGER
The CSS Cascade Or, How browsers resolve competing CSS styles. We style our websites using CSS, which stands for Cascading Style Sheets. But what does Cascading really mean?. The CSS Cascade is one of the most powerful parts of CSS. AMELIA WATTENBERGERTHINKING IN REACT HOOKSBEST REACT COMPONENTSNORMAN WATTENBERGERREACT HOOKS PREVSTATEREACT VIEW MODELREACT WEBARCHITECTURE
React introduced hooks one year ago, and they've been a game-changer for a lot of developers. There are tons of how-to introduction resources out there, but I want to talk about the fundamental mindset change when switching from React class components to functioncomponents + hooks.
AMELIA WATTENBERGER
Go home Ask me anything on Twitter Learn how to make amazing datavisualizations RSS
AMELIA WATTENBERGERTHINKING IN REACT HOOKSPODCASTS I'VE BEEN ONSCALING SVG ELEMENTSCHECK IT OUT D3.js is the de facto library for drawing data visualization on the web. Unless you are very intimately familiar with the API, you probably view it as a monolithic framework, and make charts by copy + pasting code from bl.ocks.AMELIA WATTENBERGER
I'm a huge fan of the PolicyViz Podcast with Jon Schwabish — he always has great guests, a relaxed vibe, and asks great questions. In this episode, we chat about Fullstack D3 and Data Visualization, developing data viz in the browser, and a really fun augmented reality project I worked on.AMELIA WATTENBERGER
What does 100% mean in CSS? One of the CSS units I use most is the wonderful % — so handy for positioning elements on the page. Unfortunately, the rules aren’t exactly straightforward. One question I’m always asking myself is: Percent of what? Read moreAMELIA WATTENBERGER
Over the past few weeks, 3,500 people have signed up for an invite to the Data Visualization Society to discuss, envision, and engage. Explore their expertise and location (log scaled and converted to polar coordinates) relative to you.AMELIA WATTENBERGER
Unfamiliar with the unit em? em is a CSS unit that scales with the font-size.Read more on the MDN docs.. We can think about the element as a telescope into another world.Our telescope defaults to a normal zoom level: one unit is the same as one pixel.AMELIA WATTENBERGER
Photoronoi. Upload an image or grab from a url to turn an image into a voronoi SVG. Darker parts of the image result in smaller polygons - play around with the settings to see what works best for your picture! AMELIA WATTENBERGERD3 JS GALLERYD3 JS PYTHOND3 JS EXAMPLESD3 JS TUTORIAL PDFD3 JS CHARTD3 NETWORK GRAPH EXAMPLE So, you want to create amazing data visualizations on the web and you keep hearing about D3.js. But what is D3.js, and how can you learn it? Let’s start with the question: What is D3? While it might seem like D3.js is an all-encompassing framework, it’s really just a collection of small modules.AMELIA WATTENBERGER
The CSS Cascade Or, How browsers resolve competing CSS styles. We style our websites using CSS, which stands for Cascading Style Sheets. But what does Cascading really mean?. The CSS Cascade is one of the most powerful parts of CSS. AMELIA WATTENBERGERTHINKING IN REACT HOOKSBEST REACT COMPONENTSNORMAN WATTENBERGERREACT HOOKS PREVSTATEREACT VIEW MODELREACT WEBARCHITECTURE
React introduced hooks one year ago, and they've been a game-changer for a lot of developers. There are tons of how-to introduction resources out there, but I want to talk about the fundamental mindset change when switching from React class components to functioncomponents + hooks.
AMELIA WATTENBERGER
Go home Ask me anything on Twitter Learn how to make amazing datavisualizations RSS
AMELIA WATTENBERGER
I'm a huge fan of the PolicyViz Podcast with Jon Schwabish — he always has great guests, a relaxed vibe, and asks great questions. In this episode, we chat about Fullstack D3 and Data Visualization, developing data viz in the browser, and a really fun augmented reality project I worked on.AMELIA WATTENBERGER
Thinking in React Hooks. React introduced hooks one year ago, and they've been a game-changer for a lot of developers. There are tons of how-to introduction resources out there, but I want to talk about the fundamental mindset change when switching from React class components to function components + hooks.. Read moreAMELIA WATTENBERGER
Using 2016 dog licensing data from NYC Open data and dog intelligence data from Stanley Coren, parsed and uploaded to Data WorldAMELIA WATTENBERGER
Go home Ask me anything on Twitter Learn how to make amazing datavisualizations RSS
AMELIA WATTENBERGER
Filter out articles containing strings: Select Showing 0 of 0 articlesAMELIA WATTENBERGER
One of the most enjoyable parts of the d3.js API is the d3-force module.. Using d3-force, we can create a force simulation that gives life to basic particles, moving them according to basic physicalrules.
AMELIA WATTENBERGER
I'll be sending you updates on any blogs posts I'm working on, data visualization experiments, and frontend development & design tutorials. Go back to homeAMELIA WATTENBERGER
You need to enable JavaScript to run this app. Amelia Wattenberger. You need to enable JavaScript to run this app.AMELIA WATTENBERGER
Clone the exercise repo at: github.com/Wattenberger/svg-workshop. Wattenberger. ThoughtsAMELIA WATTENBERGER
One of the CSS units I use most is the wonderful % — so handy for positioning elements on the page. Unfortunately, the rules aren’t exactly straightforward. One question I’m always asking myself is: Percent of what? What does 100% mean in CSS? You need to enable JavaScript to run this app.Hi, I’m
AMELIA WATTENBERGER
I write code, think about data, and create digital experiences. Currently Senior Journalist-Engineer at The Pudding.
Listen to podcasts I've been on , or read articles I'vewritten .
PROJECTS
DEVELOPMENT & DATA VISUALIZATIONDEBATE GAMES
TOOLS USED
D3.js
React.js
SVG
I teamed up with a friend on a game for people to play during the 2020 United States Democratic Primary Debates. While they watched, users could click on a candidate's balloon when they agreed with what theywere saying.
At the end, we have a quantified metric for how well each candidate resonated with players. It was really fun to create an in-browser game, and figuring out the best ways to sync the game with an externalvideo.
Check it out ⇛
DEVELOPMENT & DATA VISUALIZATIONINTRO TO D3.JS
TOOLS USED
D3.js
React.js
SVG
D3.js is the de facto library for drawing data visualization on the web. Unless you are very intimately familiar with the API, you probably view it as a monolithic framework, and make charts by copy + pasting code from bl.ocks. In this extensive article, I talk about every individual D3.js module, and how they factor into your goals. Writing this article was really rewarding, since I got to delve into parts of the API that I had never looked at before. For example, the different geographic projectionsand polygon methods
will definitely come in handy in thefuture!
Check it out ⇛
DEVELOPMENT & DATA VISUALIZATION INTERACTIVE CHARTS WITH D3.JSTOOLS USED
D3.js
React.js
SVG
This article is the first in a series, showing how to make your web charts interactive. It runs through two ways to add a tooltip to a histogram, while trying to show how to generalize this knowledge to create your own custom interactions. I love experimenting with taking advantage of the web to innovate on teaching. I experimented with ways to consistently keep the main code to the right of the article, which really helps keep changes incontext.
There are some really interesting bits of code involved in making this article - check them out in this website's repo.
Check it out ⇛
FULLSTACK D3 AND DATA VISUALIZATIONTOOLS USED
D3.js
SVG
Words
Having spent ten years teaching myself D3.js and designing dashboards and data visualizations, I wrote the book that I wish I could haveread.
While most books teach data visualization design _or_ development _or_ theory, my book combines all three while walking through practical examples. You'll create your first chart by the end of the first chapter - download the first chapter for free right now.
Check it out ⇛
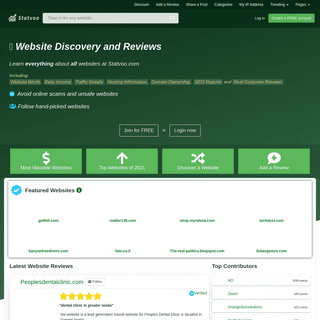
ILLEGAL FOREIGN FISHINGTOOLS USED
SVG
D3.js
Python
A weekend exploration of fishing in foreign waters - most of the work was analyzing a 7 million row dataset! Each circle is a unique profile of a country that illegally fishes in other, often poorer, countries’ waters. Data collected by Global Fishing Watch which used AIS tracking devices, among other data sources, to monitor commercial fishing activity and larger boats.Check it out ⇛
WHAT MAKES A GOOD COUNTRY?TOOLS USED
SVG
D3.js
Three.js
A brief dive into combining many metrics to decide what makes a country GOOD. There are three distinct visualizations here, exploring:*
What countries are similar (below)*
How can we group countries based on 27 metrics*
How countries rank along your own custom Axis of GoodnessCheck it out ⇛
Countries similar toUnited States
MOST SIMILAR
Australia,Japan,Chile...Laos,Eritrea,East TimorLEAST SIMILAR
DISTINCTIVE METRICS
GDP (billions PPP)🠙,health expenditure per person🠙,civil liberties score🠙,health expenditure % of GDP🠙,population🠙DOG NAMES IN NYC
TOOLS USED
d3.js
SVG
I found this great dataset of registered dog names in New York City and had to dig in. Did you know that Yorkies are the most common NYC dog? Or that a dog named Molly is most likely a Lab from Staten Island? Explore for more important dog facts!Check it out ⇛
DOG BREEDS
TOOLS USED
d3.js
SVG
I found another great doggy dataset of breed popularity over time from the American Kennel Club. This chart was an experiment to test out a new kind of tooltip that scrolls a list - check it out and tell mewhat you think!
Check it out ⇛
SKETCHES
TOOLS USED
HTML Canvas
D3.js
Once code sketch a day, usually dealing with HTML canvas animations and quick generative art.Check it out ⇛
WEATHER CIRCLE
TOOLS USED
Angular
D3.js
Dark Sky Forecast API After Umbel moved into its new office in the old Power Plant, we wanted to make a great first impression with our entrance screens. I wanted to build an interface that keeps visitors and employees informed about the weather, especially useful for planning the bestbike ride home.
I built a standalone web app that pulls current weather data from the Dark Sky Forecast API and displays today's temperature, precipitation, and sunset forecast. A clock-like layout keeps the interface familiar and easy to understand. DESIGN & DEVELOPMENT UNBIASED NEWS AGGREGATORTOOLS USED
Sentiment
React.js
RSS parsing
There are many issues with how we receive our news (in the United States). I created a news aggregator (largely for personal use) that attempts to solve three core issues.*
STORIES ARE OFTEN BIASED TOWARDS THE VIEWPOINT OF A POLITICAL PARTIES. SOLUTION: I aggregate stories from the most un-biased, fact-based publishers (based on Ad Fontes Media's Media Bias Chart).
*
ONE STORY HAS THE TENDENCY TO FLOOD PUBLIC ATTENTION. SOLUTION: I added a filter to hide stories with specific words in their title or description.*
NEWS STORIES ARE OVERWHELMINGLY SAD AND UPSETTING, WHICH CAN BE COMPELLING TO AVOID ALL NEWS. SOLUTION: I added a sentiment filter so a reader can only see stories within a specific range -- only happy stories, or only sad stories(but why).
Check it out ⇛
UMBEL SXSW PARTY PHOTOBOOTHTOOLS USED
C++
Xcode
Open Frameworks
React.js
Amazon Web Services
SCSS
In 2015, Umbel hosted an official SXSW party (with Spoon!). To incorporate our brand and liven up the VIP section, I build a virtual photobooth that superimposes a luchador mask on guests’ faces. I built a C++ app that detects faces from a webcam feed in real-time and renders a mask over anything that looks like a face (based on some training data). The face is broken into sections, and the mask is stretched to fit the different parts of the face, which makes it pretty realistic, even when someone is talking. The user can use a foot pedal to either cycle through the faces or take a picture. If you look closely, you can see people’s concentration as they try to balance and take a picture. Additionally, I built a web app to show the photos in real-time and allow people to share on social media. Read more about the construction on the Umbel Engineering blog.
OTHER
FOOSBALL TABLE
TOOLS USED
3D Printer (Ultimaker 2)Laser Cutter
Cinema 4D
Blender
From time to time, I find myself being more ambitious than I have time for. In Fall 2015, I started with the idea of scanning coworkers and replacing the players on a foosball field with their 3d-printed heads, and ended up building a whole table from scratch. I used ADOBE ILLUSTRATOR to create a design for the table, and reproduced it in CINEMA 4D to get an idea of how it would look when finished. A coworker, who happens to be an amazing woodworker, turned the bed design into a real, wooden table. Along with another coworker, I cut and etched the field out of a sheet of brand-colored acrylic, using a laser cutter. All 26 foosball players’ bodies have been 3d printed, with a threaded hole in the top for the heads to screw into. One by one, I am molding 3D scans of coworkers and printing them with screws on the bottom. Sometime in the next month, the players will be installed, along with LED lights around the field that change color when the ballis hit.
WattenbergerThoughts Amelia Wattenberger © 2020 Ask me anything on Twitter Learn how to make amazing datavisualizations RSS
Keep me up to date
Details
4