1
More Annotations


3


6
Favourite Annotations


5


3
Text
FREE STATISTICS BOOKSAMPLING DISTRIBUTIONSRICE VIRTUAL LAB IN STATISTICSMOBILESIMULATIONS e-Pub. Rice Virtual Lab in Statistics. This is the original classic with all the original simulations and case studies. David Lane is the principal developer of this resource although many others have made substantial contributions. This site was developed at Rice University, University of Houston-Clear Lake, and Tufts University.
NORMAL DISTRIBUTION
Area Under the Normal Distribution. Select "Area from a value (Use to compute p from Z)." Specify the mean and standard deviation. Indicate whether you want to find the area above a certain value, below a certain value, between two values, or outside two values. Finally, indicate the value (s). The graph will shade the area and the size ofthe
ONLINE STATISTICS: AN INTERACTIVE MULTIMEDIA COURSE OF STUDY Online Statistics: An Interactive Multimedia Course of Study . Try Version 2.0 Online Statistics: An Interactive Multimedia Course of Study is an introductory-level statistics book. FREE STATISTICS BOOK Ways to improve an angry mood: A look at gender and sports participation Research conducted by: Emily Zitek and Mindy Ater, Rice University Case study prepared by: Emily Zitek Overview People have different ways of improving their mood when angry. RICE VIRTUAL LAB IN STATISTICS (RVLS) Web based materials for teaching statistics. Includes simulations, demonstrations, case studies, and an online statistics textbook. SAMPLING DISTRIBUTIONS Instructions. Click the "Begin" button to start the simulation. This simulation lets you explore various aspects of sampling distributions. When the simulation begins, a histogram of a normal distribution is displayed at the topic of the screen. The distribution portrayed at the top of the screen is the population from which samples are taken. FREE STATISTICS BOOK Free Statistics Book CHAPTER 1: WHAT ARE STATISTICS? 7. Specify the level of measurement used for the items in Question 6. Rating of the quality of a movie on a 7 point scale—ordinalAge—interval
HISTOGRAM CROSS VALIDATION You can change the lower limit and/or bin width parameters in three ways: (1) clicking on a point in a cross-validation graph, (2) clicking the "+/-" button, and (3) entering a value in the text field and hitting return. The red points on the cross-validaton graphs show the values used by the histogram displayed above. Advanced Treatment. SAMPLING DISTRIBUTIONS Basic operations. The simulation is set to initially sample five numbers from the population, compute the mean of the five numbers, and plot the mean. Click the "Animated sample" button and you will see the five numbers appear in the histogram. The mean of the five numbers will be computed and the mean will be plotted in the third histogram. FREE STATISTICS BOOKSAMPLING DISTRIBUTIONSRICE VIRTUAL LAB IN STATISTICSMOBILESIMULATIONS e-Pub. Rice Virtual Lab in Statistics. This is the original classic with all the original simulations and case studies. David Lane is the principal developer of this resource although many others have made substantial contributions. This site was developed at Rice University, University of Houston-Clear Lake, and Tufts University.NORMAL DISTRIBUTION
Area Under the Normal Distribution. Select "Area from a value (Use to compute p from Z)." Specify the mean and standard deviation. Indicate whether you want to find the area above a certain value, below a certain value, between two values, or outside two values. Finally, indicate the value (s). The graph will shade the area and the size ofthe
ONLINE STATISTICS: AN INTERACTIVE MULTIMEDIA COURSE OF STUDY Online Statistics: An Interactive Multimedia Course of Study . Try Version 2.0 Online Statistics: An Interactive Multimedia Course of Study is an introductory-level statistics book. FREE STATISTICS BOOK Ways to improve an angry mood: A look at gender and sports participation Research conducted by: Emily Zitek and Mindy Ater, Rice University Case study prepared by: Emily Zitek Overview People have different ways of improving their mood when angry. RICE VIRTUAL LAB IN STATISTICS (RVLS) Web based materials for teaching statistics. Includes simulations, demonstrations, case studies, and an online statistics textbook. SAMPLING DISTRIBUTIONS Instructions. Click the "Begin" button to start the simulation. This simulation lets you explore various aspects of sampling distributions. When the simulation begins, a histogram of a normal distribution is displayed at the topic of the screen. The distribution portrayed at the top of the screen is the population from which samples are taken. FREE STATISTICS BOOK Free Statistics Book CHAPTER 1: WHAT ARE STATISTICS? 7. Specify the level of measurement used for the items in Question 6. Rating of the quality of a movie on a 7 point scale—ordinalAge—interval
HISTOGRAM CROSS VALIDATION You can change the lower limit and/or bin width parameters in three ways: (1) clicking on a point in a cross-validation graph, (2) clicking the "+/-" button, and (3) entering a value in the text field and hitting return. The red points on the cross-validaton graphs show the values used by the histogram displayed above. Advanced Treatment. SAMPLING DISTRIBUTIONS Basic operations. The simulation is set to initially sample five numbers from the population, compute the mean of the five numbers, and plot the mean. Click the "Animated sample" button and you will see the five numbers appear in the histogram. The mean of the five numbers will be computed and the mean will be plotted in the third histogram. ONLINE STATISTICS: AN INTERACTIVE MULTIMEDIA COURSE OF STUDY Online Statistics: An Interactive Multimedia Course of Study . Try Version 2.0 Online Statistics: An Interactive Multimedia Course of Study is an introductory-level statistics book.SIMULATIONS
An animated sample from the population is shown and the statistic is plotted. This can be repeated to estimate the sampling distribution. Concepts: sampling distribution, standard deviation, standard error, central limit theorem, mean, median, efficiency, fluctuation, skew, normal distribution. Confidence Intervals. STATISTICAL CALCULATORS Does a wide variety of statistical analyses. Computes probabilities of the binomial. Computes area of the Chi Square distribution. Computes areas of the F distribution. Use for confidence intervals. Use for confidence intervals. Computes areas of the normal distribution. BASICS OF DATA COLLECTION Well, the number one rule of data collection is to ask for information in such a way as it will be most accurately reported. Most people know their height in feet and inches and cannot quickly and accurately convert it into inches “on the fly.”. So, in order to preservedata accuracy, it
ANALYSIS LAB
Your browser either does not support JAVA or has JAVA disabled.ONE-WAY ANOVA
The ANOVA summary table based on these values is shown to the right. The sum of squares between and within are depicted graphically above the ANOVA summary table. You can choose other datasets using the pop-up menu. You can also enter your own data by clicking on the data display. If you click in a blank area, an new datapoint is created (if CONFIDENCE INTERVALS The intervals for the various samples are displayed by horizontal lines as shown below. The first two lines represent samples for which the 95% confidence interval contains the population mean of 50. The 95% confidence interval is orange and the 99% confidence interval is blue. In the third line, the 95% confidence interval does not containthe
REGRESSION BY EYE
Starting the Applet and setting the conditions. Press the "Begin" button to start the applet in another window. This applet lets you estimate the regression line and to guess the value of Pearson's correlation. Indicate your estimate of the regression line by drawing a line on the scatterplot. When you release the mouse button, the meansquare
REGRESSION TOWARD THE MEAN The default is for true scores to be sampled from a normal distribution with at mean of 60 and a standard deviation of 5. With a sample size of 1,000, the sample mean true score can be expected to be quite close to 60 (95 times out of 100 it should be be between 59.7 and 60.3). The expected score for an item that is guessed at is 0since
SMILES EXPERIMENT
Instructions. Click the "Begin" button on the left to begin the simulation. This simulation is designed to accompany the case study " Smiles and Leniency ." The experiment consisted of three experimental "smile" conditions and one control condition. The idea of the simulation is to see how likely it is that the three findings thatoccurred in
FREE STATISTICS BOOKSAMPLING DISTRIBUTIONSRICE VIRTUAL LAB IN STATISTICSMOBILESIMULATIONS e-Pub. Rice Virtual Lab in Statistics. This is the original classic with all the original simulations and case studies. David Lane is the principal developer of this resource although many others have made substantial contributions. This site was developed at Rice University, University of Houston-Clear Lake, and Tufts University. ONLINE STATISTICS: AN INTERACTIVE MULTIMEDIA COURSE OF STUDY Online Statistics: An Interactive Multimedia Course of Study . Try Version 2.0 Online Statistics: An Interactive Multimedia Course of Study is an introductory-level statistics book.NORMAL DISTRIBUTION
Area Under the Normal Distribution. Select "Area from a value (Use to compute p from Z)." Specify the mean and standard deviation. Indicate whether you want to find the area above a certain value, below a certain value, between two values, or outside two values. Finally, indicate the value (s). The graph will shade the area and the size ofthe
RICE VIRTUAL LAB IN STATISTICS (RVLS) Web based materials for teaching statistics. Includes simulations, demonstrations, case studies, and an online statistics textbook. BASICS OF DATA COLLECTION Well, the number one rule of data collection is to ask for information in such a way as it will be most accurately reported. Most people know their height in feet and inches and cannot quickly and accurately convert it into inches “on the fly.”. So, in order to preservedata accuracy, it
SAMPLING DISTRIBUTIONS Instructions. Click the "Begin" button to start the simulation. This simulation lets you explore various aspects of sampling distributions. When the simulation begins, a histogram of a normal distribution is displayed at the topic of the screen. The distribution portrayed at the top of the screen is the population from which samples are taken. HISTOGRAM CROSS VALIDATION You can change the lower limit and/or bin width parameters in three ways: (1) clicking on a point in a cross-validation graph, (2) clicking the "+/-" button, and (3) entering a value in the text field and hitting return. The red points on the cross-validaton graphs show the values used by the histogram displayed above. Advanced Treatment. FREE STATISTICS BOOK Free Statistics Book CHAPTER 1: WHAT ARE STATISTICS? 7. Specify the level of measurement used for the items in Question 6. Rating of the quality of a movie on a 7 point scale—ordinalAge—interval
SAMPLING DISTRIBUTIONS Basic operations. The simulation is set to initially sample five numbers from the population, compute the mean of the five numbers, and plot the mean. Click the "Animated sample" button and you will see the five numbers appear in the histogram. The mean of the five numbers will be computed and the mean will be plotted in the third histogram. FREE STATISTICS BOOKSAMPLING DISTRIBUTIONSRICE VIRTUAL LAB IN STATISTICSMOBILESIMULATIONS e-Pub. Rice Virtual Lab in Statistics. This is the original classic with all the original simulations and case studies. David Lane is the principal developer of this resource although many others have made substantial contributions. This site was developed at Rice University, University of Houston-Clear Lake, and Tufts University. ONLINE STATISTICS: AN INTERACTIVE MULTIMEDIA COURSE OF STUDY Online Statistics: An Interactive Multimedia Course of Study . Try Version 2.0 Online Statistics: An Interactive Multimedia Course of Study is an introductory-level statistics book.NORMAL DISTRIBUTION
Area Under the Normal Distribution. Select "Area from a value (Use to compute p from Z)." Specify the mean and standard deviation. Indicate whether you want to find the area above a certain value, below a certain value, between two values, or outside two values. Finally, indicate the value (s). The graph will shade the area and the size ofthe
RICE VIRTUAL LAB IN STATISTICS (RVLS) Web based materials for teaching statistics. Includes simulations, demonstrations, case studies, and an online statistics textbook. BASICS OF DATA COLLECTION Well, the number one rule of data collection is to ask for information in such a way as it will be most accurately reported. Most people know their height in feet and inches and cannot quickly and accurately convert it into inches “on the fly.”. So, in order to preservedata accuracy, it
SAMPLING DISTRIBUTIONS Instructions. Click the "Begin" button to start the simulation. This simulation lets you explore various aspects of sampling distributions. When the simulation begins, a histogram of a normal distribution is displayed at the topic of the screen. The distribution portrayed at the top of the screen is the population from which samples are taken. HISTOGRAM CROSS VALIDATION You can change the lower limit and/or bin width parameters in three ways: (1) clicking on a point in a cross-validation graph, (2) clicking the "+/-" button, and (3) entering a value in the text field and hitting return. The red points on the cross-validaton graphs show the values used by the histogram displayed above. Advanced Treatment. FREE STATISTICS BOOK Free Statistics Book CHAPTER 1: WHAT ARE STATISTICS? 7. Specify the level of measurement used for the items in Question 6. Rating of the quality of a movie on a 7 point scale—ordinalAge—interval
SAMPLING DISTRIBUTIONS Basic operations. The simulation is set to initially sample five numbers from the population, compute the mean of the five numbers, and plot the mean. Click the "Animated sample" button and you will see the five numbers appear in the histogram. The mean of the five numbers will be computed and the mean will be plotted in the third histogram. ONLINE STATISTICS: AN INTERACTIVE MULTIMEDIA COURSE OF STUDY Online Statistics: An Interactive Multimedia Course of Study . Try Version 2.0 Online Statistics: An Interactive Multimedia Course of Study is an introductory-level statistics book. LMS - FREE STATISTICS BOOK LMS. Learning Management Systems. The following formats are for people using learning management systems. Most likely you will need help from your IT staff to install these. Blackboard Download. Common Cartridge 1.0 Download. Common Cartridge 1.1 Download. ANGEL Download. Quizzes in Respondus Format Download (There are three quizzes for most STATISTICAL CALCULATORS Does a wide variety of statistical analyses. Computes probabilities of the binomial. Computes area of the Chi Square distribution. Computes areas of the F distribution. Use for confidence intervals. Use for confidence intervals. Computes areas of the normal distribution.MEAN AND MEDIAN
The mean and median of the numbers are both 5.0. The mean is shown on the histogram as a small blue line; the median is shown as a small purple line. The standard deviation is 1.15. Note that the standard deviation is calculated using N rather than N-1 since the numers are considered to be the entire populaiton of interest. SAMPLING DISTRIBUTIONS Basic operations. The simulation is set to initially sample five numbers from the population, compute the mean of the five numbers, and plot the mean. Click the "Animated sample" button and you will see the five numbers appear in the histogram. The mean of the five numbers will be computed and the mean will be plotted in the third histogram.INSTRUCTIONS
Basic operations. The simulation is set to initially sample five numbers from the population, compute the mean of the five numbers, and plot the mean. Click the "Animated sample" button and you will see the five numbers appear in the histogram. The mean of the five numbers will be computed and the mean will be plotted in the third histogram. CHAPTER 1: WHAT ARE STATISTICS? 7. Specify the level of measurement used for the items in Question 6. Rating of the quality of a movie on a 7 point scale—ordinalAge—interval
EXERCISES - ONLINESTATBOOK.COM Selected answers. 1. Describe the relationship between variables A and C. Think of things these variables could represent in real life. ( Ch. 4.A) 2. Make up a data set with 10 numbers that has a positive correlation. ( Ch. 4.B & Ch. 4.E) 3. Make up a data set with 10 numbers that has a negative correlation. FREE STATISTICS BOOK Ways to improve an angry mood: A look at gender and sports participation Research conducted by: Emily Zitek and Mindy Ater, Rice University Case study prepared by: Emily Zitek Overview People have different ways of improving their mood when angry.GROUP DIFFERENCES
Explanation of this Demonstrations | Other simulations/demonstrations. Sorry, you need a Java-enhanced browser to see this demonstrtion. Online Statistics Education: An Interactive Multimedia Course of Study Developed by Rice University , University of Houston Clear Lake, andTufts University
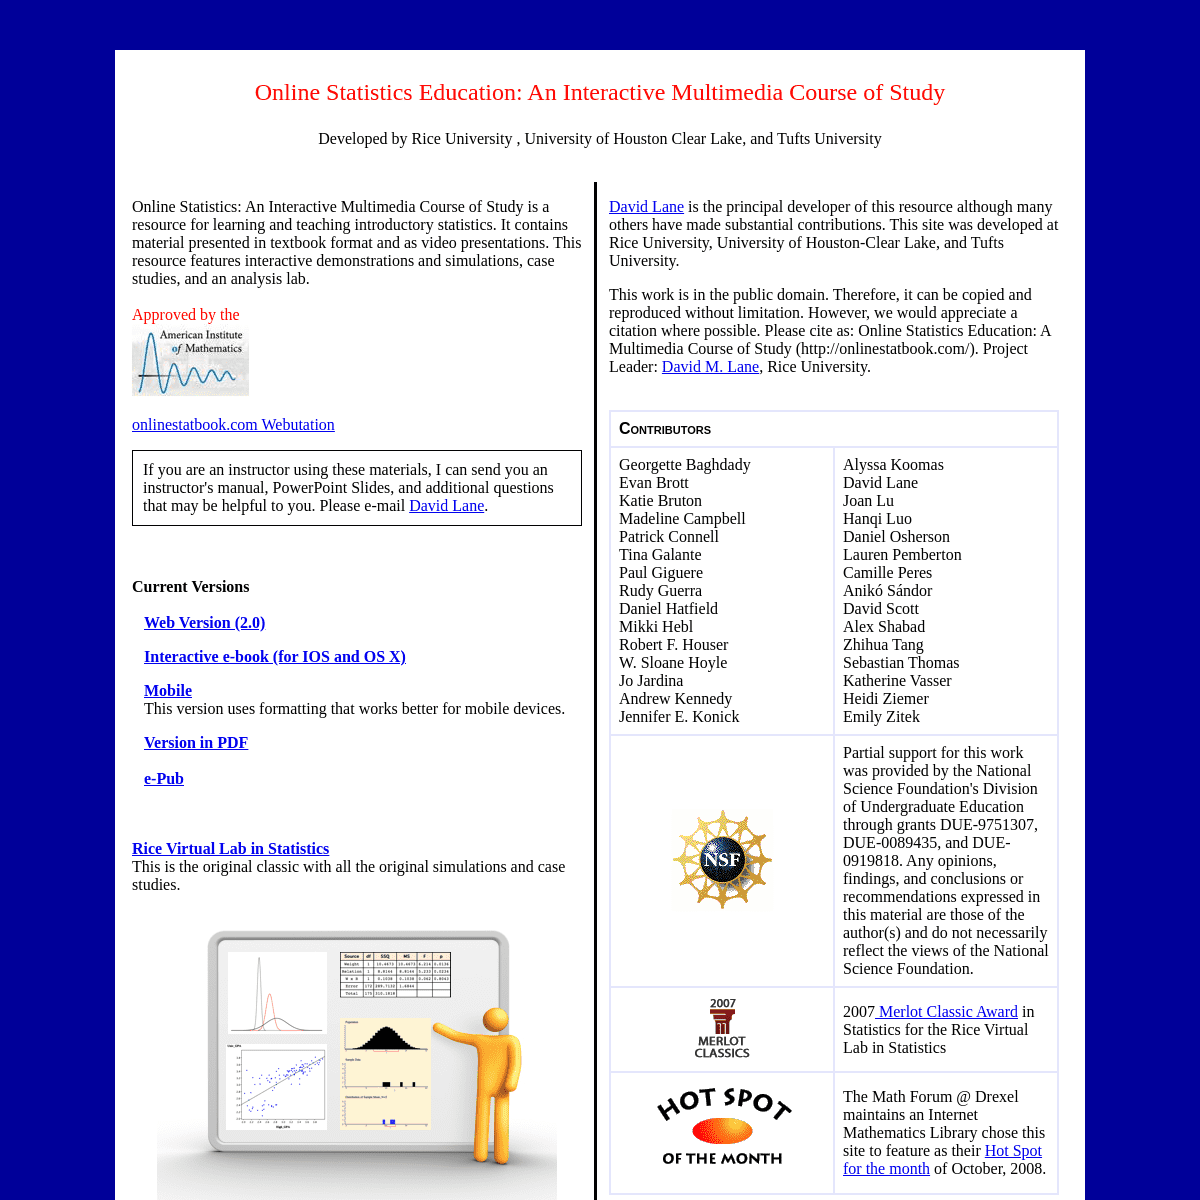
Online Statistics: An Interactive Multimedia Course of Study is a resource for learning and teaching introductory statistics. It contains material presented in textbook format and as video presentations. This resource features interactive demonstrations and simulations, case studies, and an analysis lab.Approved by the
onlinestatbook.com Webutation If you are an instructor using these materials, I can send you an instructor's manual, PowerPoint Slides, and additional questions that may be helpful to you. Please e-mail David Lane.CURRENT VERSIONS
WEB VERSION (2.0)
INTERACTIVE E-BOOK (FOR IOS AND OS X)MOBILE
This version uses formatting that works better for mobile devices.Version in PDF
e-Pub
RICE VIRTUAL LAB IN STATISTICS This is the original classic with all the original simulations andcase studies.
David Lane is the principal developer of this resource although many others have made substantial contributions. This site was developed at Rice University, University of Houston-Clear Lake, and Tufts University. This work is in the public domain. Therefore, it can be copied and reproduced without limitation. However, we would appreciate a citation where possible. Please cite as: Online Statistics Education: A Multimedia Course of Study (http://onlinestatbook.com/). Project Leader: David M. Lane , RiceUniversity.
Contributors
Georgette Baghdady
Evan Brott
Katie Bruton
Madeline Campbell
Patrick Connell
Tina Galante
Paul Giguere
Rudy Guerra
Daniel Hatfield
Mikki Hebl
Robert F. Houser
W. Sloane Hoyle
Jo Jardina
Andrew Kennedy
Jennifer E. Konick
Alyssa Koomas
David Lane
Joan Lu
Hanqi Luo
Daniel Osherson
Lauren Pemberton
Camille Peres
Anikó Sándor
David Scott
Alex Shabad
Zhihua Tang
Sebastian Thomas
Katherine Vasser
Heidi Ziemer
Emily Zitek
Partial support for this work was provided by the National Science Foundation's Division of Undergraduate Education through grants DUE-9751307, DUE-0089435, and DUE-0919818. Any opinions, findings, and conclusions or recommendations expressed in this material are those of the author(s) and do not necessarily reflect the views of the NationalScience Foundation.
2007 Merlot Classic Awardin
Statistics for the Rice Virtual Lab in Statistics The Math Forum @ Drexel maintains an Internet Mathematics Library chose this site to feature as their Hot Spot for the monthof October, 2008.
For help with statistical anxiety visit Affordable Board CertifiedCounseling
Details
3