4
More Annotations


6


5
Favourite Annotations


2


1
Text
Skip to main content
* Home
* News & Features
* Maps & Data
* Teaching Climate
* About
* Contact
* FAQs
* Site Map
* What's New?
* El Niño & La Niña FEATURED ON CLIMATE.GOV1
2
3
4
5
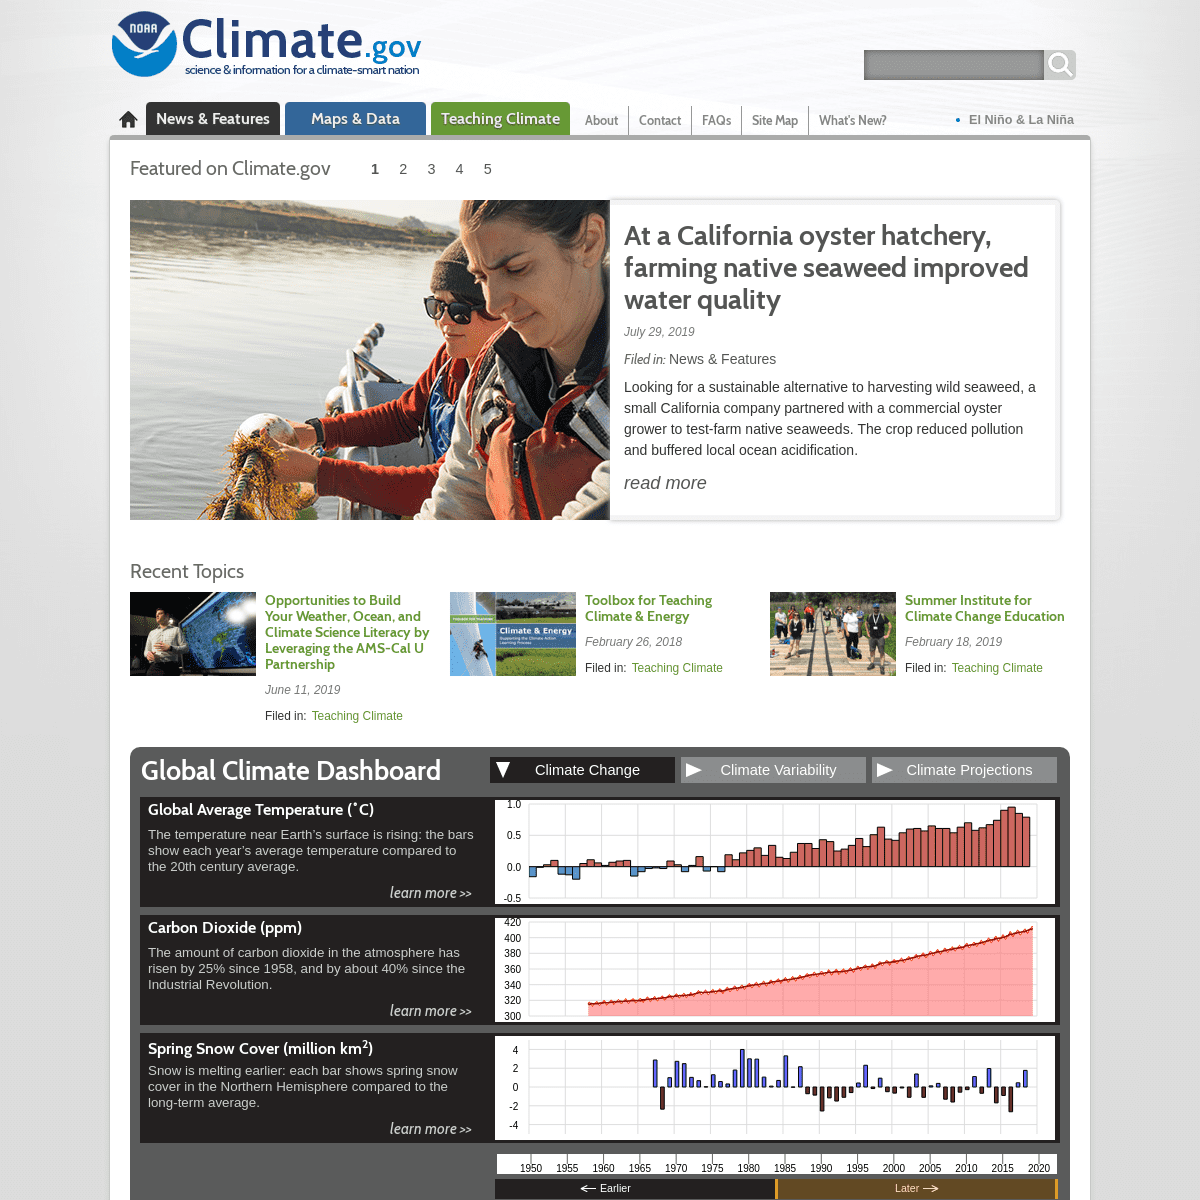
AT A CALIFORNIA OYSTER HATCHERY, FARMING NATIVE SEAWEED IMPROVED WATERQUALITY
July 29, 2019
Filed in:
News & Features
Looking for a sustainable alternative to harvesting wild seaweed, a small California company partnered with a commercial oyster grower to test-farm native seaweeds. The crop reduced pollution and buffered local ocean acidification.Read more
SIGN UP FOR CLIMATE.GOV WEEKLY NEWSLETTERJune 25, 2019
Filed in:
News & Features
NOAA Climate.gov provides science and information for a climate-smart nation. Here's how to sign up for our weekly email.Read more
COMING TO PAY PER VIEW: REIGNING CHAMP OCEAN VS. THE SCRAPPY LANDJuly 25, 2019
Dr. Haiyan Teng explains why the moisture in the ground you walk across may have important consequences for the summertime climate.Read more
CITIZEN SCIENTISTS TAKE TO THE STREETS TO MAP THE HOTTEST PLACES INTEN U.S. CITIES
July 24, 2019
Filed in:
News & Features
With specially designed sensors mounted on their own cars, volunteers in each city will drive pre-planned routes, recording heat and humidity as they go. Scientists will stitch their results into a detailed map showing the hottest parts of each city.Read more
NATIONAL CLIMATE ASSESSMENT: REDUCING GREENHOUSE GAS EMISSIONS WILL SAVE THOUSANDS OF LIVES IN THE U.S.July 22, 2019
Filed in:
News & Features
From extreme heat to infectious diseases, the impacts of human-caused global warming are a threat to human lives. According to the latest National Climate Assessment, thousands of lives could be saved in the U.S. by reducing greenhouse gases and improving resilience toclimate change.
Read more
RECENT TOPICS
*
OPPORTUNITIES TO BUILD YOUR WEATHER, OCEAN, AND CLIMATE SCIENCE LITERACY BY LEVERAGING THE AMS-CAL U PARTNERSHIPJune 11, 2019
Filed in:
Teaching Climate
*
TOOLBOX FOR TEACHING CLIMATE & ENERGYFebruary 26, 2018
Filed in:
Teaching Climate
*
SUMMER INSTITUTE FOR CLIMATE CHANGE EDUCATIONFebruary 18, 2019
Filed in:
Teaching Climate
Global Climate DashboardClimate Change
Climate Variability
Climate Projections
Global Average Temperature (˚C) The temperature near Earth’s surface is rising: the bars show each year’s average temperature compared to the 20th century average.Learn More >>
Carbon Dioxide (ppm) The amount of carbon dioxide in the atmosphere has risen by 25% since 1958, and by about 40% since the Industrial Revolution.Learn More >>
Spring Snow Cover (million km2) Snow is melting earlier: each bar shows spring snow cover in the Northern Hemisphere compared to the long-term average.Learn More >>
Earlier
Later
Temperature
Carbon Dioxide
Snow
Sea Level
Arctic Sea Ice
Ocean Heat
Sun's Energy
Glaciers
Heat-Trapping Gases
El Niño / La Niña (Oceanic Niño Index) Average sea surface temperature in the Eastern Pacific Ocean indicates El Niño (yellow), La Niña (blue), or neutral (gray) conditionsLearn More >>
Arctic Oscillation Index When this index is negative, air pressure patterns are more likely to steer severe winter storms to the eastern U.S.Learn More >>
North Atlantic Oscillation Index Air pressure patterns over the North Atlantic can steer winter weather: negative values are linked to storms in the eastern U.S.Learn More >>
Earlier
Later
El Niño / La Niña
Arctic Oscillation
North Atlantic Oscillation Southern Oscillation Pacific North American Pattern Simulation of Global Temperature Climate Model Data (CMIP3, 2007)High Growth (A2)
Moderate Growth (A1B)Low Growth (B1)
20th Century Climate The black line shows the average of many different simulations of global temperature in the 20th century compared to average from 1971-1999, and the colored lines show projected temperature changes in the 21st century for three possible emissions scenarios. The shaded areas around each line indicate the statistical spread (one standard deviation) provided by individual model runs.Learn More >>
Earlier
Later
* Home
* News & Features
* Maps & Data
* Teaching Climate
* About
* Contact
* FAQs
* Site Map
* What's New?
Follow Climate.gov
2014 Webby Award winning website Click each award to learn more * Information Quality * NOAA Freedom of Information Act* Privacy Policy
* Disclaimer
* USA.gov
* ready.gov
Details
3