6
More Annotations


4


5
Favourite Annotations


6


4
Text
XLSTAT | STATISTICAL SOFTWARE FOR EXCELFREE TRIALFAQSTATISTICAL SOFTWARE FOR EXCELTRAINING & WEBINARSTUTORIALSHELP CENTER The leading data analysis and statistical solution for Microsoft Excel. XLSTAT is a powerful yet flexible Excel data analysis add-on that allows users to analyze, XLSTAT, YOUR DATA ANALYSIS SOLUTION Your My XLSTAT account will help you closely monitor and manage your XLSTAT licenses and versions. 14-DAY FREE TRIAL & FREE VERSION Enjoy all 220+ features of XLSTAT for free during 14 days, followed by a complimentary lifetime limited edition.
XLSTAT SENSORY
XLSTAT Sensory, sensory analysis statistical tools in Excel. A reference software in sensometrics: Preference Mapping, CATA, Panel Analysis, Discrimination tests and many more.. XLSTAT Sensory is the solution for sensory data analysts who want to gain valuable time by using the most recent methods available. Take advantage of a solution that speaks your language (products, assessors XLRISK | A POWERFUL MONTE CARLO SIMULATION EXCEL® ADD-IN XLRISK®, a powerful Monte Carlo simulation Excel® add-in. XLRISK®, developed by Vose Software®, introduces many technical Monte Carlo method features that make risk models easier to build, easier to audit and test, and more precisely match the problems you face. XLSTAT | LOGICIEL STATISTIQUE POUR EXCEL La solution la plus complète d'analyse de données et de statistique pour Microsoft Excel. XLSTAT est un logiciel d'analyse de données et de statistique à la fois simple d'utilisation et très puissant. MULTIPLE CORRESPONDENCE ANALYSIS (MCA) What is Multiple Correspondence Analysis. Multiple Correspondence Analysis (MCA) is a method that allows studying the association between two or more qualitative variables.. MCA is to qualitative variables what Principal Component Analysis is to quantitative variables. One can obtain maps where it is possible to visually observe the distances between the categories of the qualitativevariables
SELF-ORGANIZING MAPS (SOM) Self-Organizing Maps are a method for unsupervised machine learning developed by Kohonen in the 1980’s. They allow reducing the dimensionality of multivariate data to low-dimensional spaces, usually 2 dimensions. Observations are assembled in nodes of similar observations.Then nodes are spread on a 2-dimensional map with similar nodes clustered next to one another. VERSION D'ESSAI DE 14 JOURS ET VERSION GRATUITE Profitez des plus de 220 fonctionnalités de XLSTAT Premium gratuitement pendant 14 jours, puis d’une version gratuite limitée comprenant 14 fonctionnalités. AGGLOMERATIVE HIERARCHICAL CLUSTERING (AHC) What is Agglomerative Hierarchical Clustering. Agglomerative Hierarchical Clustering (AHC) is a clustering (or classification) method which has the following advantages:. It works from the dissimilarities between the objects to be grouped together. XLSTAT | STATISTICAL SOFTWARE FOR EXCELFREE TRIALFAQSTATISTICAL SOFTWARE FOR EXCELTRAINING & WEBINARSTUTORIALSHELP CENTER The leading data analysis and statistical solution for Microsoft Excel. XLSTAT is a powerful yet flexible Excel data analysis add-on that allows users to analyze, XLSTAT, YOUR DATA ANALYSIS SOLUTION Your My XLSTAT account will help you closely monitor and manage your XLSTAT licenses and versions. 14-DAY FREE TRIAL & FREE VERSION Enjoy all 220+ features of XLSTAT for free during 14 days, followed by a complimentary lifetime limited edition.XLSTAT SENSORY
XLSTAT Sensory, sensory analysis statistical tools in Excel. A reference software in sensometrics: Preference Mapping, CATA, Panel Analysis, Discrimination tests and many more.. XLSTAT Sensory is the solution for sensory data analysts who want to gain valuable time by using the most recent methods available. Take advantage of a solution that speaks your language (products, assessors XLRISK | A POWERFUL MONTE CARLO SIMULATION EXCEL® ADD-IN XLRISK®, a powerful Monte Carlo simulation Excel® add-in. XLRISK®, developed by Vose Software®, introduces many technical Monte Carlo method features that make risk models easier to build, easier to audit and test, and more precisely match the problems you face. XLSTAT | LOGICIEL STATISTIQUE POUR EXCEL La solution la plus complète d'analyse de données et de statistique pour Microsoft Excel. XLSTAT est un logiciel d'analyse de données et de statistique à la fois simple d'utilisation et très puissant. MULTIPLE CORRESPONDENCE ANALYSIS (MCA) What is Multiple Correspondence Analysis. Multiple Correspondence Analysis (MCA) is a method that allows studying the association between two or more qualitative variables.. MCA is to qualitative variables what Principal Component Analysis is to quantitative variables. One can obtain maps where it is possible to visually observe the distances between the categories of the qualitativevariables
SELF-ORGANIZING MAPS (SOM) Self-Organizing Maps are a method for unsupervised machine learning developed by Kohonen in the 1980’s. They allow reducing the dimensionality of multivariate data to low-dimensional spaces, usually 2 dimensions. Observations are assembled in nodes of similar observations.Then nodes are spread on a 2-dimensional map with similar nodes clustered next to one another. VERSION D'ESSAI DE 14 JOURS ET VERSION GRATUITE Profitez des plus de 220 fonctionnalités de XLSTAT Premium gratuitement pendant 14 jours, puis d’une version gratuite limitée comprenant 14 fonctionnalités. AGGLOMERATIVE HIERARCHICAL CLUSTERING (AHC) What is Agglomerative Hierarchical Clustering. Agglomerative Hierarchical Clustering (AHC) is a clustering (or classification) method which has the following advantages:. It works from the dissimilarities between the objects to be grouped together. XLSTAT, YOUR DATA ANALYSIS SOLUTION Your My XLSTAT account will help you closely monitor and manage your XLSTAT licenses and versions.XLSTAT-EXTSTUDENT
XLSTAT is a leader in software for statistical analysis in MS Excel. Since 1993, we have worked continuously to bring you and some other 100,000 users from more than 120 countries a powerful, versatile, and above all user-friendly and affordable software to meet all of yourstatistical needs.
XLSTAT, YOUR DATA ANALYSIS SOLUTION The information entered into this form will be subjected to computer processing and is necessary to offer you the most appropriate package and pricing or solve any technical errors you share with us. XLSTAT VERSION 2021.2.2 XLSTAT 2021.2.2 is now available! What’s new? Decision Trees (available in XLSTAT Marketing & Premium); This decision aid method will help you evaluate different possible solutions to a problem and select the best option. XLSTAT VERSION 2021.2.2 Notre dernière mise à jour XLSTAT 2021.2.2 est désormais disponible ! Quoi de neuf ? Arbres de décision (disponible dans XLSTAT Marketing & Premium); Cette méthode d'aide à la décision vous permettra d’évaluer les différentes solutions possibles � XLSTAT, YOUR DATA ANALYSIS SOLUTION Dissimilarity matrix for mixed data. Gower's distance, also called Gower's coefficient, is an appropriate metric for computing pairwise dissimilarities between observations when different types occur in the same data set (e.g. nominal, ordinal, (a)symmetric binary). XLOPTIM | OPTIMIZATION SOLVER IN EXCEL® XLOPTIM® solves your operational problems by providing the efficiency of LocalSolver’s optimization engine directly inside your Excel worksheets. This no-code AI platform will help you to find powerful solutions in a short amount of time and enhance productivity in decision making scenarios. SELF-ORGANIZING MAPS (SOM) Self-Organizing Maps are a method for unsupervised machine learning developed by Kohonen in the 1980’s. They allow reducing the dimensionality of multivariate data to low-dimensional spaces, usually 2 dimensions. Observations are assembled in nodes of similar observations.Then nodes are spread on a 2-dimensional map with similar nodes clustered next to one another.YOUDEN PLOTS
What is a Youden plot? Youden (1959) developed a procedure for representing data produced by N laboratories for two similar materials A and B (they can be identical when we want to compare measurement methods, or different but expected to give identical values). HETEROSCEDASTICITY TESTS What is heteroscedasticity? The concept of heteroscedasticity - the opposite being homoscedasticity - is used in statistics, especially in the context of linear regression or for time series analysis, to describe the case where the variance of errors or the model is not the same for all observations, while often one of the basic assumption in modeling is that the variances are homogeneous and XLSTAT | STATISTICAL SOFTWARE FOR EXCELFREE TRIALFAQSTATISTICAL SOFTWARE FOR EXCELTRAINING & WEBINARSTUTORIALSHELP CENTER XLSTAT is a powerful yet flexible Excel data analysis add-on that allows users to analyze, customize and share results within Microsoft Excel. With over 240 standard to advanced statistical features available, XLSTAT is the preferred tool for statistical analysis in businesses and universities, large and small, and for 100,000+ usersin over
14-DAY FREE TRIAL & FREE VERSION 14-Day Free trial. Enjoy a 14-Day free trial for each of our software. All features are included. Analyze, customize and share your results within Microsoft Excel using this powerful yet flexible statistical add-on. The XLSTAT trial is followed by a complimentary lifetime limited edition. Try xlstat. Perform risk analysis in a vast range of XLSTAT, YOUR DATA ANALYSIS SOLUTION Your My XLSTAT account will help you closely monitor and manage your XLSTAT licenses and versions.XLSTAT SENSORY
XLSTAT Sensory, sensory analysis statistical tools in Excel. A reference software in sensometrics: Preference Mapping, CATA, Panel Analysis, Discrimination tests and many more.. XLSTAT Sensory is the solution for sensory data analysts who want to gain valuable time by using the most recent methods available. Take advantage of a solution that speaks your language (products, assessors XLRISK | A POWERFUL MONTE CARLO SIMULATION EXCEL® ADD-IN XLRISK®, a powerful Monte Carlo simulation Excel® add-in. XLRISK®, developed by Vose Software®, introduces many technical Monte Carlo method features that make risk models easier to build, easier to audit and test, and more precisely match the problems you face. MULTIPLE CORRESPONDENCE ANALYSIS (MCA) What is Multiple Correspondence Analysis. Multiple Correspondence Analysis (MCA) is a method that allows studying the association between two or more qualitative variables.. MCA is to qualitative variables what Principal Component Analysis is to quantitative variables. One can obtain maps where it is possible to visually observe the distances between the categories of the qualitativevariables
XLSTAT | LOGICIEL STATISTIQUE POUR EXCEL Logiciel de statistique (Windows et Mac) S'intègre à Microsoft Excel. Plus de 240 fonctionnalités. Analysez, modélisez et créez des rapports personnalisés sous Microsoft Excel avec cet outil à la fois simple d'utilisation et très puissant. La version d’essai est suivie d’une version gratuite limitée. Commander xlstat. SELF-ORGANIZING MAPS (SOM) Self-Organizing Maps are a method for unsupervised machine learning developed by Kohonen in the 1980’s. They allow reducing the dimensionality of multivariate data to low-dimensional spaces, usually 2 dimensions. Observations are assembled in nodes of similar observations.Then nodes are spread on a 2-dimensional map with similar nodes clustered next to one another. AGGLOMERATIVE HIERARCHICAL CLUSTERING (AHC) Agglomerative Hierarchical Clustering (AHC) is an iterative classification method whose principle is simple. The process starts by calculating the dissimilarity between the N objects. Then two objects which when clustered together minimize a given agglomeration criterion, are clustered together thus creating a class comprisingthese two objects.
VERSION D'ESSAI DE 14 JOURS ET VERSION GRATUITE Profitez d'une version d'essai de 14 jours pour chacun de nos logiciels. Toutes les fonctionnalités sont comprises. Analysez, modélisez et créez des rapports personnalisés sous Microsoft Excel avec cet outil à la fois simple d'utilisation et très puissant. La version d’essai est suivie d’une version gratuite limitée. XLSTAT | STATISTICAL SOFTWARE FOR EXCELFREE TRIALFAQSTATISTICAL SOFTWARE FOR EXCELTRAINING & WEBINARSTUTORIALSHELP CENTER XLSTAT is a powerful yet flexible Excel data analysis add-on that allows users to analyze, customize and share results within Microsoft Excel. With over 240 standard to advanced statistical features available, XLSTAT is the preferred tool for statistical analysis in businesses and universities, large and small, and for 100,000+ usersin over
14-DAY FREE TRIAL & FREE VERSION 14-Day Free trial. Enjoy a 14-Day free trial for each of our software. All features are included. Analyze, customize and share your results within Microsoft Excel using this powerful yet flexible statistical add-on. The XLSTAT trial is followed by a complimentary lifetime limited edition. Try xlstat. Perform risk analysis in a vast range of XLSTAT, YOUR DATA ANALYSIS SOLUTION Your My XLSTAT account will help you closely monitor and manage your XLSTAT licenses and versions.XLSTAT SENSORY
XLSTAT Sensory, sensory analysis statistical tools in Excel. A reference software in sensometrics: Preference Mapping, CATA, Panel Analysis, Discrimination tests and many more.. XLSTAT Sensory is the solution for sensory data analysts who want to gain valuable time by using the most recent methods available. Take advantage of a solution that speaks your language (products, assessors XLRISK | A POWERFUL MONTE CARLO SIMULATION EXCEL® ADD-IN XLRISK®, a powerful Monte Carlo simulation Excel® add-in. XLRISK®, developed by Vose Software®, introduces many technical Monte Carlo method features that make risk models easier to build, easier to audit and test, and more precisely match the problems you face. MULTIPLE CORRESPONDENCE ANALYSIS (MCA) What is Multiple Correspondence Analysis. Multiple Correspondence Analysis (MCA) is a method that allows studying the association between two or more qualitative variables.. MCA is to qualitative variables what Principal Component Analysis is to quantitative variables. One can obtain maps where it is possible to visually observe the distances between the categories of the qualitativevariables
XLSTAT | LOGICIEL STATISTIQUE POUR EXCEL Logiciel de statistique (Windows et Mac) S'intègre à Microsoft Excel. Plus de 240 fonctionnalités. Analysez, modélisez et créez des rapports personnalisés sous Microsoft Excel avec cet outil à la fois simple d'utilisation et très puissant. La version d’essai est suivie d’une version gratuite limitée. Commander xlstat. SELF-ORGANIZING MAPS (SOM) Self-Organizing Maps are a method for unsupervised machine learning developed by Kohonen in the 1980’s. They allow reducing the dimensionality of multivariate data to low-dimensional spaces, usually 2 dimensions. Observations are assembled in nodes of similar observations.Then nodes are spread on a 2-dimensional map with similar nodes clustered next to one another. AGGLOMERATIVE HIERARCHICAL CLUSTERING (AHC) Agglomerative Hierarchical Clustering (AHC) is an iterative classification method whose principle is simple. The process starts by calculating the dissimilarity between the N objects. Then two objects which when clustered together minimize a given agglomeration criterion, are clustered together thus creating a class comprisingthese two objects.
VERSION D'ESSAI DE 14 JOURS ET VERSION GRATUITE Profitez d'une version d'essai de 14 jours pour chacun de nos logiciels. Toutes les fonctionnalités sont comprises. Analysez, modélisez et créez des rapports personnalisés sous Microsoft Excel avec cet outil à la fois simple d'utilisation et très puissant. La version d’essai est suivie d’une version gratuite limitée. XLSTAT, YOUR DATA ANALYSIS SOLUTION Your My XLSTAT account will help you closely monitor and manage your XLSTAT licenses and versions. XLSTAT, YOUR DATA ANALYSIS SOLUTION The recipients of the data will be ADDINSOFT and XLSTAT only and will be kept for three years. According to the Data Protection Act of January 6th, 1978, you have at any time, a right of access to and rectification of all of your personal data. If you wish to exercise this right and gain access to your personal data, please write to ourdata
XLSTAT-EXTSTUDENT
XLSTAT is a leader in software for statistical analysis in MS Excel. Since 1993, we have worked continuously to bring you and some other 100,000 users from more than 120 countries a powerful, versatile, and above all user-friendly and affordable software to meet all of yourstatistical needs.
XLSTAT VERSION 2021.2.2 XLSTAT 2021.2.2 is now available! What’s new? Decision Trees (available in XLSTAT Marketing & Premium); This decision aid method will help you evaluate different possible solutions to a problem and select the best option.YOUDEN PLOTS
Options for the XLSTAT Youden Plots function. Originally, Youden made a prerequisite that the 2 materials tested are fairly close and that the measurements are on identical scales. However, if this is not the case, the XLSTAT user can request that the data be standardized. To standardize the two samples, the user has the option of choosing XLSTAT VERSION 2021.2.2 Notre dernière mise à jour XLSTAT 2021.2.2 est désormais disponible ! Quoi de neuf ? Arbres de décision (disponible dans XLSTAT Marketing & Premium); Cette méthode d'aide à la décision vous permettra d’évaluer les différentes solutions possibles � XLSTAT, YOUR DATA ANALYSIS SOLUTION Dissimilarity matrix for mixed data. Gower's distance, also called Gower's coefficient, is an appropriate metric for computing pairwise dissimilarities between observations when different types occur in the same data set (e.g. nominal, ordinal, (a)symmetric binary). SELF-ORGANIZING MAPS (SOM) Self-Organizing Maps are a method for unsupervised machine learning developed by Kohonen in the 1980’s. They allow reducing the dimensionality of multivariate data to low-dimensional spaces, usually 2 dimensions. Observations are assembled in nodes of similar observations.Then nodes are spread on a 2-dimensional map with similar nodes clustered next to one another. HETEROSCEDASTICITY TESTS Testing for Heteroscedasticity. If it is suspected that the variances are not homogeneous (a representation of the residuals against the explanatory variables may reveal heteroscedasticity), it is therefore necessary to perform a test for heteroscedasticity. Several tests have been developed, with the following null and alternative hypotheses: STATISTIQUES DE MULTICOLINÉARITÉ La fonctionnalité XLSTAT-régression linéaire permet de calculer automatiquement les statistiques de multicolinéarité sur les variables explicatives. Ainsi, l’utilisateur peut choisir d’éliminer les variables explicatives trop redondantes avec les autres. Notons que la XLSTAT | STATISTICAL SOFTWARE FOR EXCELFREE TRIALFAQSTATISTICAL SOFTWARE FOR EXCELTRAINING & WEBINARSTUTORIALSHELP CENTER The leading data analysis and statistical solution for Microsoft Excel. XLSTAT is a powerful yet flexible Excel data analysis add-on that allows users to analyze, XLSTAT, YOUR DATA ANALYSIS SOLUTION Your My XLSTAT account will help you closely monitor and manage your XLSTAT licenses and versions. XLSTAT, YOUR DATA ANALYSIS SOLUTION The information entered into this form will be subjected to computer processing and is necessary to offer you the most appropriate package and pricing or solve any technical errors you share with us.XLSTAT-EXTSTUDENT
XLSTAT is a leader in software for statistical analysis in MS Excel. Since 1993, we have worked continuously to bring you and some other 100,000 users from more than 120 countries a powerful, versatile, and above all user-friendly and affordable software to meet all of yourstatistical needs.
XLRISK | A POWERFUL MONTE CARLO SIMULATION EXCEL® ADD-IN XLRISK®, a powerful Monte Carlo simulation Excel® add-in. XLRISK®, developed by Vose Software®, introduces many technical Monte Carlo method features that make risk models easier to build, easier to audit and test, and more precisely match the problems you face.YOUDEN PLOTS
What is a Youden plot? Youden (1959) developed a procedure for representing data produced by N laboratories for two similar materials A and B (they can be identical when we want to compare measurement methods, or different but expected to give identical values). SELF-ORGANIZING MAPS (SOM) Self-Organizing Maps are a method for unsupervised machine learning developed by Kohonen in the 1980’s. They allow reducing the dimensionality of multivariate data to low-dimensional spaces, usually 2 dimensions. Observations are assembled in nodes of similar observations.Then nodes are spread on a 2-dimensional map with similar nodes clustered next to one another. HETEROSCEDASTICITY TESTS What is heteroscedasticity? The concept of heteroscedasticity - the opposite being homoscedasticity - is used in statistics, especially in the context of linear regression or for time series analysis, to describe the case where the variance of errors or the model is not the same for all observations, while often one of the basic assumption in modeling is that the variances are homogeneous and XLSTAT | LOGICIEL STATISTIQUE POUR EXCEL La solution la plus complète d'analyse de données et de statistique pour Microsoft Excel. XLSTAT est un logiciel d'analyse de données et de statistique à la fois simple d'utilisation et très puissant. XLSTAT TROUBLESHOOTING Microsoft Excel 16.22 crash on Mac during XLSTAT launch. This problem concerns users who use XLSTAT on a Mac with a specific Microsoft Excel version (16.22 or 16.23). XLSTAT | STATISTICAL SOFTWARE FOR EXCELFREE TRIALFAQSTATISTICAL SOFTWARE FOR EXCELTRAINING & WEBINARSTUTORIALSHELP CENTER The leading data analysis and statistical solution for Microsoft Excel. XLSTAT is a powerful yet flexible Excel data analysis add-on that allows users to analyze, XLSTAT, YOUR DATA ANALYSIS SOLUTION Your My XLSTAT account will help you closely monitor and manage your XLSTAT licenses and versions. XLSTAT, YOUR DATA ANALYSIS SOLUTION The information entered into this form will be subjected to computer processing and is necessary to offer you the most appropriate package and pricing or solve any technical errors you share with us.XLSTAT-EXTSTUDENT
XLSTAT is a leader in software for statistical analysis in MS Excel. Since 1993, we have worked continuously to bring you and some other 100,000 users from more than 120 countries a powerful, versatile, and above all user-friendly and affordable software to meet all of yourstatistical needs.
XLRISK | A POWERFUL MONTE CARLO SIMULATION EXCEL® ADD-IN XLRISK®, a powerful Monte Carlo simulation Excel® add-in. XLRISK®, developed by Vose Software®, introduces many technical Monte Carlo method features that make risk models easier to build, easier to audit and test, and more precisely match the problems you face.YOUDEN PLOTS
What is a Youden plot? Youden (1959) developed a procedure for representing data produced by N laboratories for two similar materials A and B (they can be identical when we want to compare measurement methods, or different but expected to give identical values). SELF-ORGANIZING MAPS (SOM) Self-Organizing Maps are a method for unsupervised machine learning developed by Kohonen in the 1980’s. They allow reducing the dimensionality of multivariate data to low-dimensional spaces, usually 2 dimensions. Observations are assembled in nodes of similar observations.Then nodes are spread on a 2-dimensional map with similar nodes clustered next to one another. HETEROSCEDASTICITY TESTS What is heteroscedasticity? The concept of heteroscedasticity - the opposite being homoscedasticity - is used in statistics, especially in the context of linear regression or for time series analysis, to describe the case where the variance of errors or the model is not the same for all observations, while often one of the basic assumption in modeling is that the variances are homogeneous and XLSTAT | LOGICIEL STATISTIQUE POUR EXCEL La solution la plus complète d'analyse de données et de statistique pour Microsoft Excel. XLSTAT est un logiciel d'analyse de données et de statistique à la fois simple d'utilisation et très puissant. XLSTAT TROUBLESHOOTING Microsoft Excel 16.22 crash on Mac during XLSTAT launch. This problem concerns users who use XLSTAT on a Mac with a specific Microsoft Excel version (16.22 or 16.23). XLSTAT, YOUR DATA ANALYSIS SOLUTION Your My XLSTAT account will help you closely monitor and manage your XLSTAT licenses and versions. 14-DAY FREE TRIAL & FREE VERSION Enjoy all 220+ features of XLSTAT for free during 14 days, followed by a complimentary lifetime limited edition. XLSTAT VERSION 2020.1 How to get XLSTAT 2020.1?. Version 2020.1 will provide you access to improvements, advanced options and increase the performance of your software. Installing this XLSTAT VERSION 2021.2.2 XLSTAT 2021.2.2 is now available! What’s new? Decision Trees (available in XLSTAT Marketing & Premium); This decision aid method will help you evaluate different possible solutions to a problem and select the best option. XLSTAT, YOUR DATA ANALYSIS SOLUTION Dissimilarity matrix for mixed data. Gower's distance, also called Gower's coefficient, is an appropriate metric for computing pairwise dissimilarities between observations when different types occur in the same data set (e.g. nominal, ordinal, (a)symmetric binary). XLSTAT VERSION 2021.2.2 Notre dernière mise à jour XLSTAT 2021.2.2 est désormais disponible ! Quoi de neuf ? Arbres de décision (disponible dans XLSTAT Marketing & Premium); Cette méthode d'aide à la décision vous permettra d’évaluer les différentes solutions possibles �3D VISUALIZATION
Visualisation in three dimensions (3-D) It is always possible to represent more than two variables in a 2-D graphic. You can do that by playing with the color, shape and HETEROSCEDASTICITY TESTS What is heteroscedasticity? The concept of heteroscedasticity - the opposite being homoscedasticity - is used in statistics, especially in the context of linear regression or for time series analysis, to describe the case where the variance of errors or the model is not the same for all observations, while often one of the basic assumption in modeling is that the variances are homogeneous and SURFACE RESPONSE DESIGNS What is a Surface Response Design? The family of surface response design is used for modeling and analysis of problems in which a response of interest is influenced by several variables and the objective is to optimize this response. PRODUCT CHARACTERIZATION Product characterization quickly detects descriptors that best discriminate a set of products. Available in Excel using the XLSTAT statistical software. XLSTAT, YOUR DATA ANALYSIS SOLUTION Your My XLSTAT account will help you closely monitor and manage your XLSTAT licenses and versions. XLSTAT | STATISTICAL SOFTWARE FOR EXCEL XLSTAT is a powerful yet flexible Excel data analysis add-on that allows users to analyze, customize and share results within Microsoft Excel. With over 240 standard to advanced statistical features available, XLSTAT is the preferred tool for statistical analysis in businesses and universities, large and small, and for 100,000+ usersin over
14-DAY FREE TRIAL & FREE VERSION 14-Day Free trial. Enjoy a 14-Day free trial for each of our software. All features are included. Analyze, customize and share your results within Microsoft Excel using this powerful yet flexible statistical add-on. The XLSTAT trial is followed by a complimentary lifetime limited edition. Try xlstat. Perform risk analysis in a vast range ofXLSTAT-EXTSTUDENT
XLSTAT is a leader in software for statistical analysis in MS Excel. Since 1993, we have worked continuously to bring you and some other 100,000 users from more than 120 countries a powerful, versatile, and above all user-friendly and affordable software to meet all of yourstatistical needs.
XLSTAT SENSORY
XLSTAT Sensory, sensory analysis statistical tools in Excel. A reference software in sensometrics: Preference Mapping, CATA, Panel Analysis, Discrimination tests and many more.. XLSTAT Sensory is the solution for sensory data analysts who want to gain valuable time by using the most recent methods available. Take advantage of a solution that speaks your language (products, assessors XLSTAT VERSION 2020.1 Version 2020.1 will provide you access to improvements, advanced options and increase the performance of your software. Installing this version is recommended to all users. If you are currently using our trial version or if you have a valid license, you can XLRISK | A POWERFUL MONTE CARLO SIMULATION EXCEL® ADD-IN XLRISK®, a powerful Monte Carlo simulation Excel® add-in. XLRISK®, developed by Vose Software®, introduces many technical Monte Carlo method features that make risk models easier to build, easier to audit and test, and more precisely match the problems you face. SURFACE RESPONSE DESIGNS The family of surface response design is used for modeling and analysis of problems in which a response of interest is influenced by several variables and the objective is to optimize this response. Remark: In contrast to this, screening designs aim to study the input factors, not the response value. For example, suppose that an engineerwants
XLSTAT | LOGICIEL STATISTIQUE POUR EXCEL Logiciel de statistique (Windows et Mac) S'intègre à Microsoft Excel. Plus de 240 fonctionnalités. Analysez, modélisez et créez des rapports personnalisés sous Microsoft Excel avec cet outil à la fois simple d'utilisation et très puissant. La version d’essai est suivie d’une version gratuite limitée. Commander xlstat. SELF-ORGANIZING MAPS (SOM) Self-Organizing Maps are a method for unsupervised machine learning developed by Kohonen in the 1980’s. They allow reducing the dimensionality of multivariate data to low-dimensional spaces, usually 2 dimensions. Observations are assembled in nodes of similar observations.Then nodes are spread on a 2-dimensional map with similar nodes clustered next to one another. XLSTAT, YOUR DATA ANALYSIS SOLUTION Your My XLSTAT account will help you closely monitor and manage your XLSTAT licenses and versions. XLSTAT | STATISTICAL SOFTWARE FOR EXCEL XLSTAT is a powerful yet flexible Excel data analysis add-on that allows users to analyze, customize and share results within Microsoft Excel. With over 240 standard to advanced statistical features available, XLSTAT is the preferred tool for statistical analysis in businesses and universities, large and small, and for 100,000+ usersin over
14-DAY FREE TRIAL & FREE VERSION 14-Day Free trial. Enjoy a 14-Day free trial for each of our software. All features are included. Analyze, customize and share your results within Microsoft Excel using this powerful yet flexible statistical add-on. The XLSTAT trial is followed by a complimentary lifetime limited edition. Try xlstat. Perform risk analysis in a vast range ofXLSTAT-EXTSTUDENT
XLSTAT is a leader in software for statistical analysis in MS Excel. Since 1993, we have worked continuously to bring you and some other 100,000 users from more than 120 countries a powerful, versatile, and above all user-friendly and affordable software to meet all of yourstatistical needs.
XLSTAT SENSORY
XLSTAT Sensory, sensory analysis statistical tools in Excel. A reference software in sensometrics: Preference Mapping, CATA, Panel Analysis, Discrimination tests and many more.. XLSTAT Sensory is the solution for sensory data analysts who want to gain valuable time by using the most recent methods available. Take advantage of a solution that speaks your language (products, assessors XLSTAT VERSION 2020.1 Version 2020.1 will provide you access to improvements, advanced options and increase the performance of your software. Installing this version is recommended to all users. If you are currently using our trial version or if you have a valid license, you can XLRISK | A POWERFUL MONTE CARLO SIMULATION EXCEL® ADD-IN XLRISK®, a powerful Monte Carlo simulation Excel® add-in. XLRISK®, developed by Vose Software®, introduces many technical Monte Carlo method features that make risk models easier to build, easier to audit and test, and more precisely match the problems you face. SURFACE RESPONSE DESIGNS The family of surface response design is used for modeling and analysis of problems in which a response of interest is influenced by several variables and the objective is to optimize this response. Remark: In contrast to this, screening designs aim to study the input factors, not the response value. For example, suppose that an engineerwants
XLSTAT | LOGICIEL STATISTIQUE POUR EXCEL Logiciel de statistique (Windows et Mac) S'intègre à Microsoft Excel. Plus de 240 fonctionnalités. Analysez, modélisez et créez des rapports personnalisés sous Microsoft Excel avec cet outil à la fois simple d'utilisation et très puissant. La version d’essai est suivie d’une version gratuite limitée. Commander xlstat. SELF-ORGANIZING MAPS (SOM) Self-Organizing Maps are a method for unsupervised machine learning developed by Kohonen in the 1980’s. They allow reducing the dimensionality of multivariate data to low-dimensional spaces, usually 2 dimensions. Observations are assembled in nodes of similar observations.Then nodes are spread on a 2-dimensional map with similar nodes clustered next to one another. XLSTAT, YOUR DATA ANALYSIS SOLUTION Order. Choose one of our software. Analyze, customize and share your results within Microsoft Excel using this powerful yet flexible statistical add-on. The XLSTAT trial is followed by a complimentary lifetime limited edition. Order xlstat. Perform risk analysis in a vast range of fields and get answers to a huge range of questionsusing this
XLSTAT PREMIUM
XLSTAT is a leader in software for statistical analysis in MS Excel. Since 1993, we have worked continuously to bring you and some other 100,000 users from more than 120 countries a powerful, versatile, and above all user-friendly and affordable software to meet all of yourstatistical needs.
XLSTAT BASIC
XLSTAT is a leader in software for statistical analysis in MS Excel. Since 1993, we have worked continuously to bring you and some other 100,000 users from more than 120 countries a powerful, versatile, and above all user-friendly and affordable software to meet all of yourstatistical needs.
XLSTAT, YOUR DATA ANALYSIS SOLUTION The recipients of the data will be ADDINSOFT and XLSTAT only and will be kept for three years. According to the Data Protection Act of January 6th, 1978, you have at any time, a right of access to and rectification of all of your personal data. If you wish to exercise this right and gain access to your personal data, please write to ourdata
XLSTAT-EXTSTUDENT
XLSTAT is a leader in software for statistical analysis in MS Excel. Since 1993, we have worked continuously to bring you and some other 100,000 users from more than 120 countries a powerful, versatile, and above all user-friendly and affordable software to meet all of yourstatistical needs.
TRAINING COURSES: AGENDA Trainings & Webinars. Addinsoft organizes training sessions that allow you to refresh your knowledge in statistics and data analysis while enabling you to master XLSTAT.We provide course material that gives you an overview of, and detailed information on, each studied method. In addition, our courses are based around real life case studies so XLSTAT VERSION 2021.2.2 XLSTAT 2021.2.2 is now available! What’s new? Decision Trees (available in XLSTAT Marketing & Premium); This decision aid method will help you evaluate different possible solutions to a problem and select the best option. XLSTAT VERSION 2021.2.2 Notre dernière mise à jour XLSTAT 2021.2.2 est désormais disponible ! Quoi de neuf ? Arbres de décision (disponible dans XLSTAT Marketing & Premium); Cette méthode d'aide à la décision vous permettra d’évaluer les différentes solutions possibles � HETEROSCEDASTICITY TESTS Testing for Heteroscedasticity. If it is suspected that the variances are not homogeneous (a representation of the residuals against the explanatory variables may reveal heteroscedasticity), it is therefore necessary to perform a test for heteroscedasticity. Several tests have been developed, with the following null and alternative hypotheses: PRINCIPAL COMPONENT ANALYSIS (PCA) Principal Component Analysis in Excel. Principal Component Analysis (PCA) is a powerful and popular multivariate analysis method that lets you investigate multidimensional datasets with quantitative variables. It is widely used in biostatistics, marketing, sociology, and manyother fields.
XLSTAT, YOUR DATA ANALYSIS SOLUTION Your My XLSTAT account will help you closely monitor and manage your XLSTAT licenses and versions. XLSTAT | STATISTICAL SOFTWARE FOR EXCELXLSTAT FOR EXCELADD XLSTAT EXCELXLSTAT 365XLSTAT ADD IN FREEXLSTAT FREE DOWNLOAD The leading data analysis and statistical solution for Microsoft Excel. XLSTAT is a powerful yet flexible Excel data analysis add-on that allows users to analyze, 14-DAY FREE TRIAL & FREE VERSION Enjoy all 220+ features of XLSTAT for free during 14 days, followed by a complimentary lifetime limited edition.XLSTAT-EXTSTUDENT
XLSTAT is a leader in software for statistical analysis in MS Excel. Since 1993, we have worked continuously to bring you and some other 100,000 users from more than 120 countries a powerful, versatile, and above all user-friendly and affordable software to meet all of yourstatistical needs.
XLSTAT SENSORY
XLSTAT Sensory, sensory analysis statistical tools in Excel. A reference software in sensometrics: Preference Mapping, CATA, Panel Analysis, Discrimination tests and many more.. XLSTAT Sensory is the solution for sensory data analysts who want to gain valuable time by using the most recent methods available. Take advantage of a solution that speaks your language (products, assessors XLSTAT VERSION 2020.1 How to get XLSTAT 2020.1?. Version 2020.1 will provide you access to improvements, advanced options and increase the performance of your software. Installing this XLRISK | A POWERFUL MONTE CARLO SIMULATION EXCEL® ADD-INFREE STATISTICAL SOFTWARE FOR EXCELMICROSOFT STATISTICAL ANALYSIS SOFTWARESTATISTICAL PACKAGE FOR EXCELEXCEL STATISTICAL ANALYSIS ADD INEXCEL STATISTICAL PACKAGE XLRISK®, a powerful Monte Carlo simulation Excel® add-in. XLRISK®, developed by Vose Software®, introduces many technical Monte Carlo method features that make risk models easier to build, easier to audit and test, and more precisely match the problems you face. HETEROSCEDASTICITY TESTS What is heteroscedasticity? The concept of heteroscedasticity - the opposite being homoscedasticity - is used in statistics, especially in the context of linear regression or for time series analysis, to describe the case where the variance of errors or the model is not the same for all observations, while often one of the basic assumption in modeling is that the variances are homogeneous and SELF-ORGANIZING MAPS (SOM) Self-Organizing Maps are a method for unsupervised machine learning developed by Kohonen in the 1980’s. They allow reducing the dimensionality of multivariate data to low-dimensional spaces, usually 2 dimensions. Observations are assembled in nodes of similar observations.Then nodes are spread on a 2-dimensional map with similar nodes clustered next to one another. XLSTAT | LOGICIEL STATISTIQUE POUR EXCEL La solution la plus complète d'analyse de données et de statistique pour Microsoft Excel. XLSTAT est un logiciel d'analyse de données et de statistique à la fois simple d'utilisation et très puissant. XLSTAT, YOUR DATA ANALYSIS SOLUTION Your My XLSTAT account will help you closely monitor and manage your XLSTAT licenses and versions. XLSTAT | STATISTICAL SOFTWARE FOR EXCELXLSTAT FOR EXCELADD XLSTAT EXCELXLSTAT 365XLSTAT ADD IN FREEXLSTAT FREE DOWNLOAD The leading data analysis and statistical solution for Microsoft Excel. XLSTAT is a powerful yet flexible Excel data analysis add-on that allows users to analyze, 14-DAY FREE TRIAL & FREE VERSION Enjoy all 220+ features of XLSTAT for free during 14 days, followed by a complimentary lifetime limited edition.XLSTAT-EXTSTUDENT
XLSTAT is a leader in software for statistical analysis in MS Excel. Since 1993, we have worked continuously to bring you and some other 100,000 users from more than 120 countries a powerful, versatile, and above all user-friendly and affordable software to meet all of yourstatistical needs.
XLSTAT SENSORY
XLSTAT Sensory, sensory analysis statistical tools in Excel. A reference software in sensometrics: Preference Mapping, CATA, Panel Analysis, Discrimination tests and many more.. XLSTAT Sensory is the solution for sensory data analysts who want to gain valuable time by using the most recent methods available. Take advantage of a solution that speaks your language (products, assessors XLSTAT VERSION 2020.1 How to get XLSTAT 2020.1?. Version 2020.1 will provide you access to improvements, advanced options and increase the performance of your software. Installing this XLRISK | A POWERFUL MONTE CARLO SIMULATION EXCEL® ADD-INFREE STATISTICAL SOFTWARE FOR EXCELMICROSOFT STATISTICAL ANALYSIS SOFTWARESTATISTICAL PACKAGE FOR EXCELEXCEL STATISTICAL ANALYSIS ADD INEXCEL STATISTICAL PACKAGE XLRISK®, a powerful Monte Carlo simulation Excel® add-in. XLRISK®, developed by Vose Software®, introduces many technical Monte Carlo method features that make risk models easier to build, easier to audit and test, and more precisely match the problems you face. HETEROSCEDASTICITY TESTS What is heteroscedasticity? The concept of heteroscedasticity - the opposite being homoscedasticity - is used in statistics, especially in the context of linear regression or for time series analysis, to describe the case where the variance of errors or the model is not the same for all observations, while often one of the basic assumption in modeling is that the variances are homogeneous and SELF-ORGANIZING MAPS (SOM) Self-Organizing Maps are a method for unsupervised machine learning developed by Kohonen in the 1980’s. They allow reducing the dimensionality of multivariate data to low-dimensional spaces, usually 2 dimensions. Observations are assembled in nodes of similar observations.Then nodes are spread on a 2-dimensional map with similar nodes clustered next to one another. XLSTAT | LOGICIEL STATISTIQUE POUR EXCEL La solution la plus complète d'analyse de données et de statistique pour Microsoft Excel. XLSTAT est un logiciel d'analyse de données et de statistique à la fois simple d'utilisation et très puissant. XLSTAT, YOUR DATA ANALYSIS SOLUTION Analyze, customize and share your results within Microsoft Excel using this powerful yet flexible statistical add-on. The XLSTAT trial is followed by a complimentary lifetime limited edition.XLSTAT PREMIUM
XLSTAT is a leader in software for statistical analysis in MS Excel. Since 1993, we have worked continuously to bring you and some other 100,000 users from more than 120 countries a powerful, versatile, and above all user-friendly and affordable software to meet all of yourstatistical needs.
XLSTAT BASIC
XLSTAT is a leader in software for statistical analysis in MS Excel. Since 1993, we have worked continuously to bring you and some other 100,000 users from more than 120 countries a powerful, versatile, and above all user-friendly and affordable software to meet all of yourstatistical needs.
XLSTAT-EXTSTUDENT
XLSTAT is a leader in software for statistical analysis in MS Excel. Since 1993, we have worked continuously to bring you and some other 100,000 users from more than 120 countries a powerful, versatile, and above all user-friendly and affordable software to meet all of yourstatistical needs.
XLSTAT, YOUR DATA ANALYSIS SOLUTION The information entered into this form will be subjected to computer processing and is necessary to offer you the most appropriate package and pricing or solve any technical errors you share with us. TRAINING COURSES: AGENDA Senior statistics consultant. Jean-Paul Maalouf is a senior statistics consultant working at Addinsoft since 2014. He holds a PhD in biology and has a substantial experience in teaching statistics, an activity he has been intensively practicing since 2012. HETEROSCEDASTICITY TESTS What is heteroscedasticity? The concept of heteroscedasticity - the opposite being homoscedasticity - is used in statistics, especially in the context of linear regression or for time series analysis, to describe the case where the variance of errors or the model is not the same for all observations, while often one of the basic assumption in modeling is that the variances are homogeneous and PRINCIPAL COMPONENT ANALYSIS (PCA) Principal Component Analysis in Excel. Principal Component Analysis (PCA) is a powerful and popular multivariate analysis method that lets you investigate multidimensional datasets with quantitative variables. It is widely used in biostatistics, marketing, sociology, and manyother fields.
VERSION D'ESSAI DE 14 JOURS ET VERSION GRATUITE Profitez des plus de 220 fonctionnalités de XLSTAT Premium gratuitement pendant 14 jours, puis d’une version gratuite limitée comprenant 14 fonctionnalités. XLSTAT SUPPORT CENTER Need a hand? All the help you want just a few clicks away. Have a Question? Ask or enter a search term here.×Close
__
__English
* English
* Français
* Deutsch
* Español
* 日本語
__Company
* About us
* Distributors
* News
* Client references
* Presentation materials* Legal information
* Microsoft partner
__Login
*
Username:__
Password:Forgot your password? ____Search
*
__
Toggle navigation
* Products
*
__XLSTATFEATURES OVERVIEWSolutions
* __XLSTAT-Base
* __XLSTAT-Premium
* __XLSTAT-Sensory
* __XLSTAT-Marketing* __XLSTAT-Forecast
* __XLSTAT-Biomed
* __XLSTAT-Ecology
* __XLSTAT-Psy
* __XLSTAT-Quality
OPTIONS
* __XLSTAT-3DPlot
* __XLSTAT-LatentClass* __XLSTAT-R
Compare
* __Features Overview* Order
* Training & Consultancy*
__TRAINING & WEBINARS__TAILORED COURSES
__CONSULTANCY
* Help Center
*
__GETTING STARTED
__TUTORIALS
__IDEAS
__VIDEOS
* Free Trial
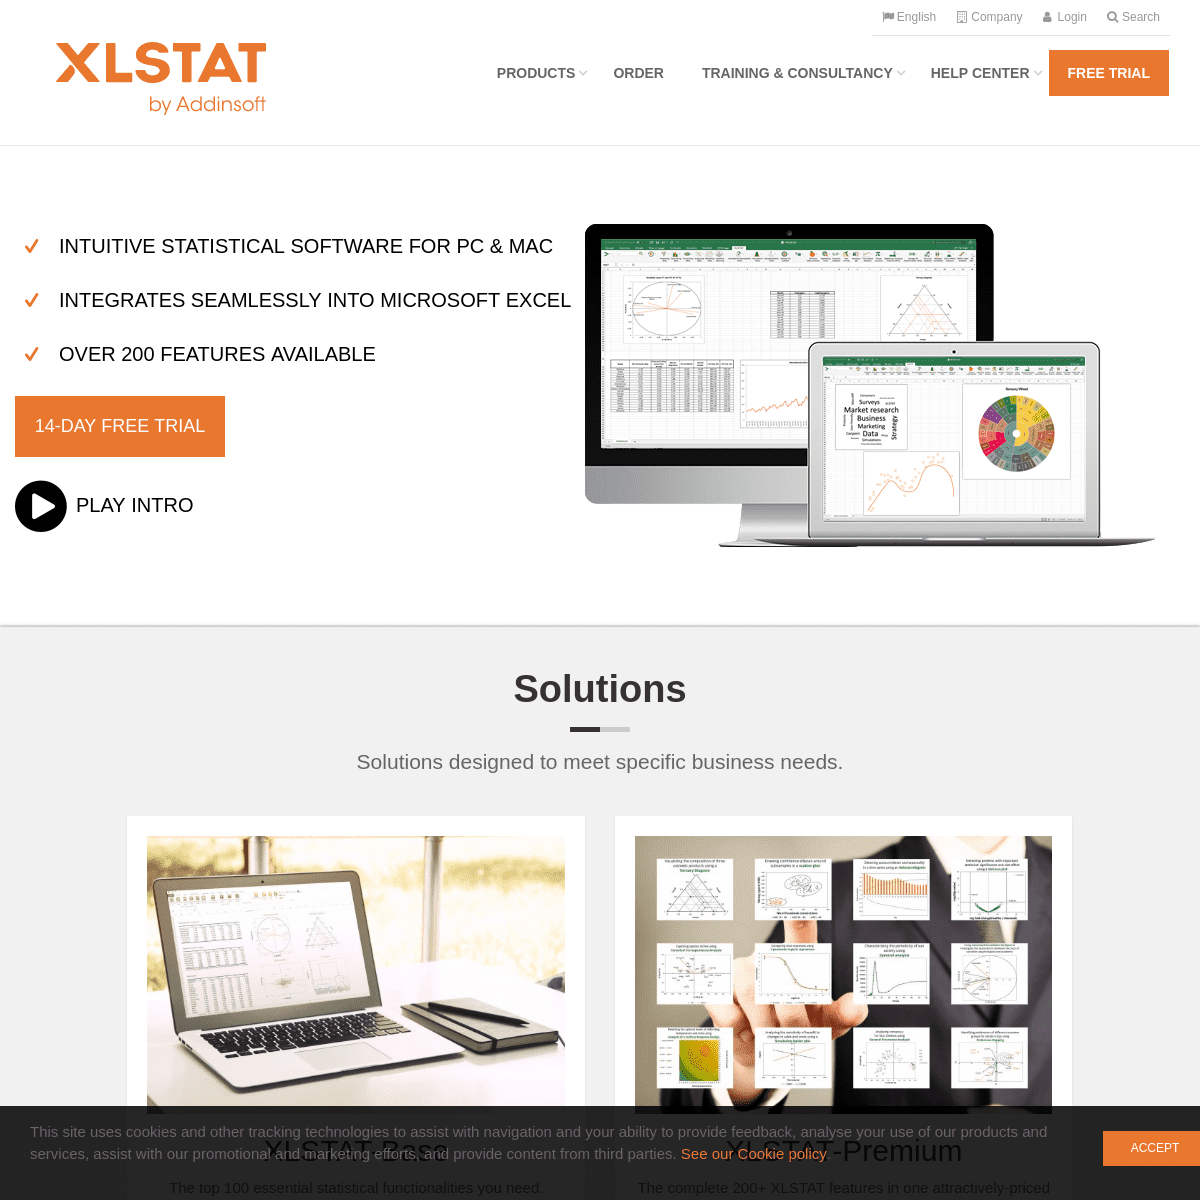
* __INTUITIVE STATISTICAL SOFTWARE FOR PC & MAC * __INTEGRATES SEAMLESSLY INTO MICROSOFT EXCEL * __OVER 200 FEATURES AVAILABLE* 14-Day Free trial
* __Play intro
SOLUTIONS
Solutions designed to meet specific business needs.XLSTAT-BASE
The top 100 essential statistical functionalities you need.Find out more
XLSTAT-PREMIUM
The complete 200+ XLSTAT features in one attractively-priced package.Find out more
XLSTAT-SENSORY
The solution that gives you in-depth insight into your products andconsumers.
Find out more
XLSTAT-MARKETING
The indispensable tool for quantitative marketeers who need to understand customer behavior and trends, and make the right decision.Find out more
XLSTAT-FORECAST
A solution that combines the most accurate prevision tools in one user-friendly interface.Find out more
XLSTAT-BIOMED
A comprehensive solution for biologists and medical researchers who require quick and accurate results.Find out more
XLSTAT-ECOLOGY
Transform the complex ecological data you capture in the field intoscience.
Find out more
XLSTAT-PSY
An intuitive and efficient software for analyzing complex psychological and social data.Find out more
XLSTAT-QUALITY
The essential solution for those whose jobs involve quality controland risk analysis.
Find out more
COMBINE THE POWER OF XLSTAT, R & MS EXCEL®Find out more
14-DAY FREE TRIAL & FREE VERSION__ Win __ Mac
CORE FEATURES
XLSTAT benefits
__
EASY AND USER-FRIENDLY XLSTAT seamlessly integrates into Microsoft Excel, making data analysis and result customization quick and easy.__
A WIDE RANGE OF SOLUTIONS A variety of field-specific solutions on offer.__
INTUITIVE
Dialog boxes and results are clearly organized to facilitate both data analysis and the interpretation of results.__
COMPETITIVELY-PRICED Attractively priced so that your return on investment is almostimmediate.
__
AVAILABLE IN SEVERAL LANGUAGES English, French, German, Italian, Japanese, Spanish and Portuguese.__
AUTOMATED & CUSTOMIZABLE Most statistical functions can be modified and automated in VBA routines allowing you to save valuable time. CUSTOMER SERVICE SATISFACTION__0 %
TECHNICAL SUPPORT SATISFACTION__0 %
RECOMMENDATIONS
__0 %
Help Center
ABOUT XLSTAT
The leading data analysis and statistical solution for MicrosoftExcel®.
XLSTAT is a powerful yet flexible Excel data analysis add-on that allows users to analyze, customize and share results within Microsoft Excel. With over 200 standard to advanced statistical features available, XLSTAT is the preferred tool for statistical analysis in businesses and universities. The XLSTAT statistical analysis software is compatible with all Excel versions from version 2003 to version 2016 (2011 and 2016 for Mac), and is compatible with Windows Vista to Windows 10 systems, as well as with PowerPC and Intel based Mac systems. Because it is powerful, reliable, affordable, easy to install and to use, XLSTAT has grown to be one of the most commonly used statistical software packages on the market. Today, the XLSTAT community includes more than 100,000 users, businesses and universities, large and small, in over 200 countries across the world. Annual licenses start as low as $50 for students, $165 for academics and $275 USD for other users, making XLSTAT eminently affordable. In addition, XLSTAT offers top level support services that free statistical software solutions do not provide. XLSTAT can be purchased online through a highly secured site, anytime, anywhere. Both electronic and CD-Rom versions are available.EVENTS
*
HANDS ON SENSORY STATISTICS COURSE, PARIS MARCH 27-29 2019 Training date: Mar 27, 2019 This course forms a hands-on introduction to those statistical methods needed by a sensory scientist.*
HANDS ON SENSORY STATISTICS COURSE, NEW YORK OCT 2-4 2019 Training date: Oct 2, 2019 This course forms a hands-on introduction to those statistical methods needed by a sensory scientist.*
HANDS ON CONSUMER DRIVEN PRODUCT OPTIMIZATION, CHICAGO APRIL 10-122019
Training date: Apr 10, 2019 Three one-day workshops designed to give you the knowledge practice and tools to analyse consumer test data and to optimise the sensory properties of foods, beverages, personal products.NEWS
*
XLSTAT AT THE 13TH PANGBORN SENSORY SCIENCE SYMPOSIUM 2019Jul 23, 2019
XLSTAT will be present at the 13th Pangborn Sensory Science Symposium, 28 July - 1 August 2019, Edinburgh UK*
A GLOBAL SOCIOECONOMIC STUDY BASED ON THE 2019 INDEX OF ECONOMIC FREEDOM - A WHITE PAPER FROM XLSTATJul 4, 2019
This white paper aims to identify groups of countries with similar socioeconomic indicators using the Index of Economic Freedom.*
XLSTAT AT JSM 2019
Jun 27, 2019
XLSTAT is a Silver sponsor of JSM 2019, Denver, Wednesday, July 31.@XLSTAT
* __
📣 @XLSTAT goes orange at this year’s #JSM2019 conference! #Denver ⏩ Visit us at booth 302 🍿 Enjoy a popcorn break c… https://t.co/XcMXkD4WTu* __
✅ Discover the @XLSTAT #Probability Calculator through a simple application! ✅ 👨💻 #Teachers will find this tool pa… https://t.co/reAF5GkcaF* __
👨💻 Fabien will discuss segmentation techniques of subjects in a CATA experiment with atypical subjects. ✅ The… https://t.co/zo7TQd8uYPFind out more
A complete statistical add-in for Microsoft Excel.* __
* __
* __
* __
Contact us Help CenterSOLUTIONS
* XLSTAT-Base
* XLSTAT-Premium
* XLSTAT-Sensory
* XLSTAT-Marketing
* XLSTAT-Forecast
* XLSTAT-Biomed
* XLSTAT-Ecology
* XLSTAT-Psy
* XLSTAT-Quality
LINKS
* Products
* Order
* Training & Consultancy* Help Center
* Free Trial
Copyright © 2017 Addinsoft. All Rights Reserved.Toggle navigation
* Legal mentions
* Use of cookies
* Privacy policy
* Terms of use
This site uses cookies and other tracking technologies to assist with navigation and your ability to provide feedback, analyse your use of our products and services, assist with our promotional and marketing efforts, and provide content from third parties. See our Cookie policy.
Accept
Details
4