1
More Annotations


6


3
Favourite Annotations


2


1
Text
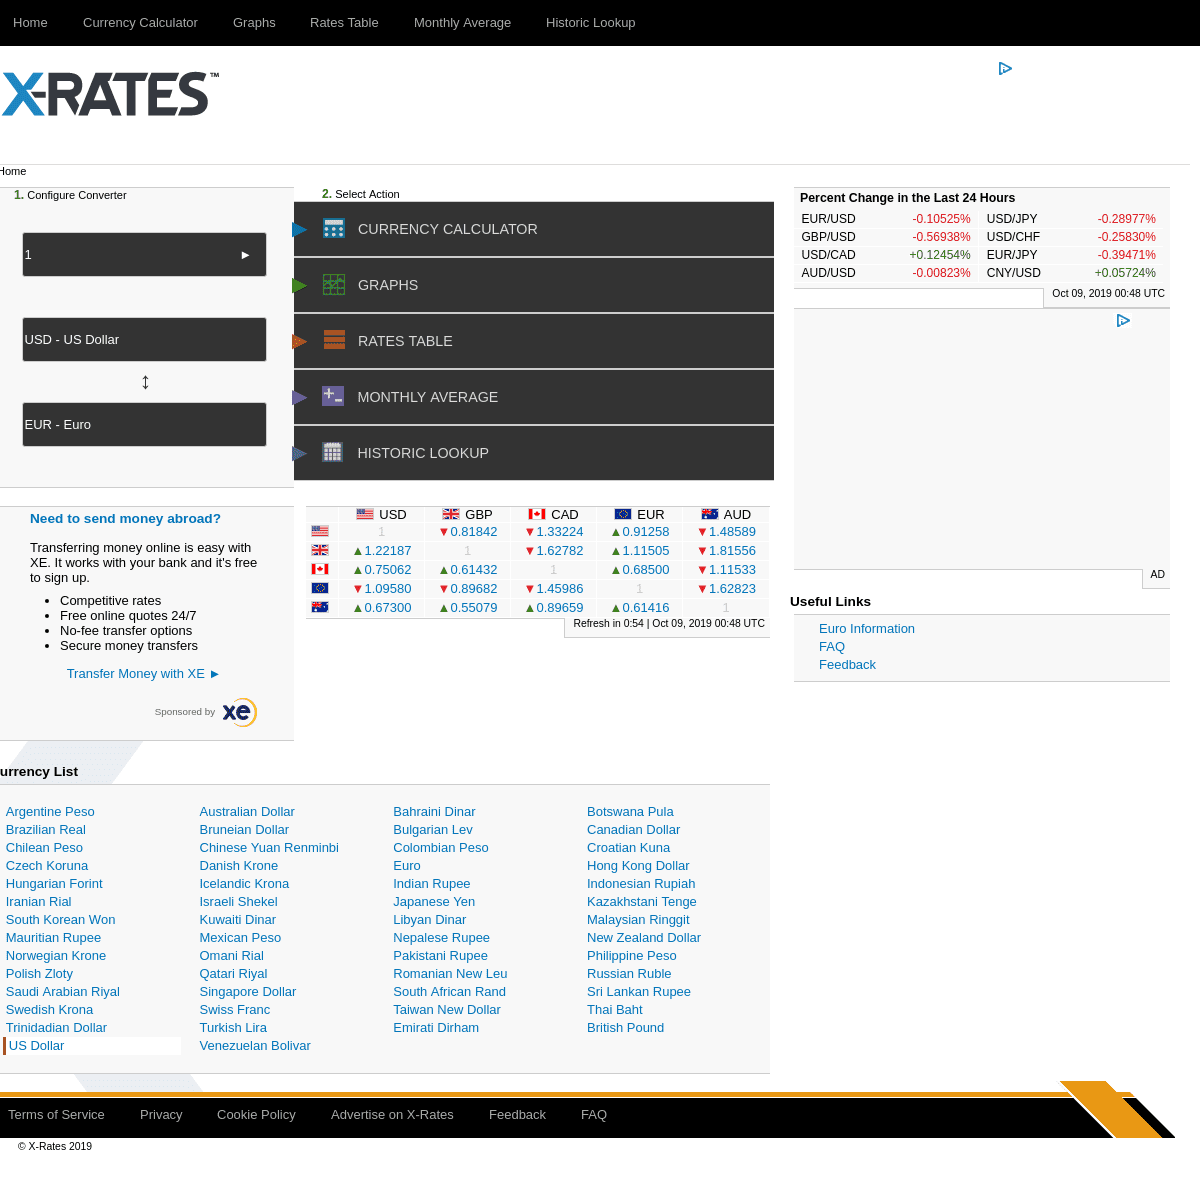
EXCHANGE RATES
Free foreign exchange rates and tools including a currency conversion calculator, historical rates and graphs, and a monthly exchange rateaverage.
EXCHANGE RATE AVERAGE (US DOLLAR, CANADIAN DOLLAR) US Dollar Monthly average. averageYear 2021 2020 2019 2018 2017 2016 2015 2014 2013 2012 2011. Graph is being loaded Jan 1.272665 – 31 days. Feb 1.269959 – 28 days. Mar 1.257353 – 31 days. Apr 1.251245 – 30 days. May 1.216677 – 22 days. View USD Rates Table. USD HISTORICAL EXCHANGE RATES (US DOLLAR) Get historic exchange rates for past US Dollar foreign expenses. Select your currencies and the date to get histroical rate tables. EXCHANGE RATE AVERAGE (US DOLLAR, EURO) Monthly AverageConverterEuro per 1 US Dollar Monthly average. averageYear 2021 2020 2019 2018 2017 2016 2015 2014 2013 2012 2011. Graph is being loaded Jan 0.821704 – 31 days. Feb 0.826723 – 28 days. Mar 0.839597 – 31 days. Apr 0.836743 – 30 days. May 0.825950 – 22 days. View USD Rates Table. EXCHANGE RATE AVERAGE (EURO, US DOLLAR) Monthly AverageConverterUS Dollar per 1 Euro Monthly average. averageYear 2021 2020 2019 2018 2017 2016 2015 2014 2013 2012 2011. Graph is being loaded Jan 1.216983 – 31 days. Feb 1.209595 – 28 days. Mar 1.191048 – 31 days. Apr 1.195110 – 30 days. May 1.213595 – 30 days. View EUR Rates Table. EUR HISTORICAL EXCHANGE RATES (EURO) Get historic exchange rates for past Euro foreign expenses. Select your currencies and the date to get histroical rate tables. EXCHANGE RATE AVERAGE (EURO, BRITISH POUND) Monthly AverageConverterBritish Pound per 1 Euro Monthly average. averageYear 2021 2020 2019 2018 2017 2016 2015 2014 2013 2012 2011. Graph is being loaded Jan 0.892395 – 31 days. Feb 0.872511 – 28 days. Mar 0.859129 – 31 days. Apr 0.863840 – 30 days. May 0.863523 – 29 days. View EUR Rates Table. HKD HISTORICAL EXCHANGE RATES (HONG KONG DOLLAR) Get historic exchange rates for past Hong Kong Dollar foreign expenses. Select your currencies and the date to get histroical ratetables.
GBP HISTORICAL EXCHANGE RATES (BRITISH POUND) Get historic exchange rates for past British Pound foreign expenses. Select your currencies and the date to get histroical rate tables. EXCHANGE RATE AVERAGE (BRITISH POUND, AUSTRALIAN DOLLAR Mar 1.798511 – 31 days. Apr 1.798747 – 30 days. May 1.808646 – 29 days. View GBP Rates Table. View AUD Rates Table. View GBP / AUD Graphs. View GBP / AUD Currency Calculator. 1. Configure Converter.EXCHANGE RATES
Free foreign exchange rates and tools including a currency conversion calculator, historical rates and graphs, and a monthly exchange rateaverage.
EXCHANGE RATE AVERAGE (US DOLLAR, CANADIAN DOLLAR) US Dollar Monthly average. averageYear 2021 2020 2019 2018 2017 2016 2015 2014 2013 2012 2011. Graph is being loaded Jan 1.272665 – 31 days. Feb 1.269959 – 28 days. Mar 1.257353 – 31 days. Apr 1.251245 – 30 days. May 1.216677 – 22 days. View USD Rates Table. USD HISTORICAL EXCHANGE RATES (US DOLLAR) Get historic exchange rates for past US Dollar foreign expenses. Select your currencies and the date to get histroical rate tables. EXCHANGE RATE AVERAGE (US DOLLAR, EURO) Monthly AverageConverterEuro per 1 US Dollar Monthly average. averageYear 2021 2020 2019 2018 2017 2016 2015 2014 2013 2012 2011. Graph is being loaded Jan 0.821704 – 31 days. Feb 0.826723 – 28 days. Mar 0.839597 – 31 days. Apr 0.836743 – 30 days. May 0.825950 – 22 days. View USD Rates Table. EXCHANGE RATE AVERAGE (EURO, US DOLLAR) Monthly AverageConverterUS Dollar per 1 Euro Monthly average. averageYear 2021 2020 2019 2018 2017 2016 2015 2014 2013 2012 2011. Graph is being loaded Jan 1.216983 – 31 days. Feb 1.209595 – 28 days. Mar 1.191048 – 31 days. Apr 1.195110 – 30 days. May 1.213595 – 30 days. View EUR Rates Table. EUR HISTORICAL EXCHANGE RATES (EURO) Get historic exchange rates for past Euro foreign expenses. Select your currencies and the date to get histroical rate tables. EXCHANGE RATE AVERAGE (EURO, BRITISH POUND) Monthly AverageConverterBritish Pound per 1 Euro Monthly average. averageYear 2021 2020 2019 2018 2017 2016 2015 2014 2013 2012 2011. Graph is being loaded Jan 0.892395 – 31 days. Feb 0.872511 – 28 days. Mar 0.859129 – 31 days. Apr 0.863840 – 30 days. May 0.863523 – 29 days. View EUR Rates Table. HKD HISTORICAL EXCHANGE RATES (HONG KONG DOLLAR) Get historic exchange rates for past Hong Kong Dollar foreign expenses. Select your currencies and the date to get histroical ratetables.
GBP HISTORICAL EXCHANGE RATES (BRITISH POUND) Get historic exchange rates for past British Pound foreign expenses. Select your currencies and the date to get histroical rate tables. EXCHANGE RATE AVERAGE (BRITISH POUND, AUSTRALIAN DOLLAR Mar 1.798511 – 31 days. Apr 1.798747 – 30 days. May 1.808646 – 29 days. View GBP Rates Table. View AUD Rates Table. View GBP / AUD Graphs. View GBP / AUD Currency Calculator. 1. Configure Converter. EXCHANGE RATE AVERAGE (US DOLLAR, CANADIAN DOLLAR) US Dollar Monthly average. averageYear 2021 2020 2019 2018 2017 2016 2015 2014 2013 2012 2011. Graph is being loaded Jan 1.272665 – 31 days. Feb 1.269959 – 28 days. Mar 1.257353 – 31 days. Apr 1.251245 – 30 days. May 1.216677 – 22 days. View USD Rates Table. USD HISTORICAL EXCHANGE RATES (US DOLLAR) Get historic exchange rates for past US Dollar foreign expenses. Select your currencies and the date to get histroical rate tables. CAD HISTORICAL EXCHANGE RATES (CANADIAN DOLLAR) Get historic exchange rates for past Canadian Dollar foreign expenses. Select your currencies and the date to get histroical rate tables. USD HISTORICAL EXCHANGE RATES (US DOLLAR) Get historic exchange rates for past US Dollar foreign expenses. Select your currencies and the date to get histroical rate tables. USD HISTORICAL EXCHANGE RATES (US DOLLAR) Get historic exchange rates for past US Dollar foreign expenses. Select your currencies and the date to get histroical rate tables. EXCHANGE RATE AVERAGE (US DOLLAR, EURO) Monthly AverageConverterEuro per 1 US Dollar Monthly average. averageYear 2021 2020 2019 2018 2017 2016 2015 2014 2013 2012 2011. Graph is being loaded Jan 0.821704 – 31 days. Feb 0.826723 – 28 days. Mar 0.839597 – 31 days. Apr 0.836743 – 30 days. May 0.825950 – 22 days. View USD Rates Table. EXCHANGE RATE AVERAGE (EURO, US DOLLAR) Monthly AverageConverterUS Dollar per 1 Euro Monthly average. averageYear 2021 2020 2019 2018 2017 2016 2015 2014 2013 2012 2011. Graph is being loaded Jan 1.110785 – 31 days. Feb 1.091858 – 29 days. Mar 1.106977 – 31 days. Apr 1.087027 – 30 days. May 1.092001 – 31 days. Jun 1.125007 – 30 days. EXCHANGE RATE AVERAGE (ISRAELI SHEKEL, US DOLLAR) May 0.284344 – 31 days. Jun 0.289205 – 30 days. Jul 0.291193 – 31 days. Aug 0.294050 – 31 days. Sep 0.292100 – 30 days. Oct 0.294491 – 31 days. Nov 0.297408 – 30 days. Dec 0.307768 – 31 days. View ILS Rates Table. EUR HISTORICAL EXCHANGE RATES (EURO) Get historic exchange rates for past Euro foreign expenses. Select your currencies and the date to get histroical rate tables. IRR HISTORICAL EXCHANGE RATES (IRANIAN RIAL) Get historic exchange rates for past Iranian Rial foreign expenses. Select your currencies and the date to get histroical rate tables.EXCHANGE RATES
Free foreign exchange rates and tools including a currency conversion calculator, historical rates and graphs, and a monthly exchange rateaverage.
EXCHANGE RATE AVERAGE (US DOLLAR, CANADIAN DOLLAR) US Dollar Monthly average. averageYear 2021 2020 2019 2018 2017 2016 2015 2014 2013 2012 2011. Graph is being loaded Jan 1.272665 – 31 days. Feb 1.269959 – 28 days. Mar 1.257353 – 31 days. Apr 1.251245 – 30 days. May 1.216677 – 22 days. View USD Rates Table. USD HISTORICAL EXCHANGE RATES (US DOLLAR) Get historic exchange rates for past US Dollar foreign expenses. Select your currencies and the date to get histroical rate tables. EXCHANGE RATE AVERAGE (EURO, US DOLLAR) Monthly AverageConverterUS Dollar per 1 Euro Monthly average. averageYear 2021 2020 2019 2018 2017 2016 2015 2014 2013 2012 2011. Graph is being loaded Jan 1.216983 – 31 days. Feb 1.209595 – 28 days. Mar 1.191048 – 31 days. Apr 1.195110 – 30 days. May 1.213595 – 30 days. View EUR Rates Table. EXCHANGE RATE AVERAGE (US DOLLAR, EURO) Monthly AverageConverterEuro per 1 US Dollar Monthly average. averageYear 2021 2020 2019 2018 2017 2016 2015 2014 2013 2012 2011. Graph is being loaded Jan 0.821704 – 31 days. Feb 0.826723 – 28 days. Mar 0.839597 – 31 days. Apr 0.836743 – 30 days. May 0.825950 – 22 days. View USD Rates Table. EXCHANGE RATE AVERAGE (EURO, BRITISH POUND) Monthly AverageConverterBritish Pound per 1 Euro Monthly average. averageYear 2021 2020 2019 2018 2017 2016 2015 2014 2013 2012 2011. Graph is being loaded Jan 0.892395 – 31 days. Feb 0.872511 – 28 days. Mar 0.859129 – 31 days. Apr 0.863840 – 30 days. May 0.863523 – 29 days. View EUR Rates Table. JPY HISTORICAL EXCHANGE RATES (JAPANESE YEN) Get historic exchange rates for past Japanese Yen foreign expenses. Select your currencies and the date to get histroical rate tables. HKD HISTORICAL EXCHANGE RATES (HONG KONG DOLLAR) Get historic exchange rates for past Hong Kong Dollar foreign expenses. Select your currencies and the date to get histroical ratetables.
GBP HISTORICAL EXCHANGE RATES (BRITISH POUND) Get historic exchange rates for past British Pound foreign expenses. Select your currencies and the date to get histroical rate tables. EXCHANGE RATE AVERAGE (BRITISH POUND, AUSTRALIAN DOLLAR Mar 1.798511 – 31 days. Apr 1.798747 – 30 days. May 1.808646 – 29 days. View GBP Rates Table. View AUD Rates Table. View GBP / AUD Graphs. View GBP / AUD Currency Calculator. 1. Configure Converter.EXCHANGE RATES
Free foreign exchange rates and tools including a currency conversion calculator, historical rates and graphs, and a monthly exchange rateaverage.
EXCHANGE RATE AVERAGE (US DOLLAR, CANADIAN DOLLAR) US Dollar Monthly average. averageYear 2021 2020 2019 2018 2017 2016 2015 2014 2013 2012 2011. Graph is being loaded Jan 1.272665 – 31 days. Feb 1.269959 – 28 days. Mar 1.257353 – 31 days. Apr 1.251245 – 30 days. May 1.216677 – 22 days. View USD Rates Table. USD HISTORICAL EXCHANGE RATES (US DOLLAR) Get historic exchange rates for past US Dollar foreign expenses. Select your currencies and the date to get histroical rate tables. EXCHANGE RATE AVERAGE (EURO, US DOLLAR) Monthly AverageConverterUS Dollar per 1 Euro Monthly average. averageYear 2021 2020 2019 2018 2017 2016 2015 2014 2013 2012 2011. Graph is being loaded Jan 1.216983 – 31 days. Feb 1.209595 – 28 days. Mar 1.191048 – 31 days. Apr 1.195110 – 30 days. May 1.213595 – 30 days. View EUR Rates Table. EXCHANGE RATE AVERAGE (US DOLLAR, EURO) Monthly AverageConverterEuro per 1 US Dollar Monthly average. averageYear 2021 2020 2019 2018 2017 2016 2015 2014 2013 2012 2011. Graph is being loaded Jan 0.821704 – 31 days. Feb 0.826723 – 28 days. Mar 0.839597 – 31 days. Apr 0.836743 – 30 days. May 0.825950 – 22 days. View USD Rates Table. EXCHANGE RATE AVERAGE (EURO, BRITISH POUND) Monthly AverageConverterBritish Pound per 1 Euro Monthly average. averageYear 2021 2020 2019 2018 2017 2016 2015 2014 2013 2012 2011. Graph is being loaded Jan 0.892395 – 31 days. Feb 0.872511 – 28 days. Mar 0.859129 – 31 days. Apr 0.863840 – 30 days. May 0.863523 – 29 days. View EUR Rates Table. JPY HISTORICAL EXCHANGE RATES (JAPANESE YEN) Get historic exchange rates for past Japanese Yen foreign expenses. Select your currencies and the date to get histroical rate tables. HKD HISTORICAL EXCHANGE RATES (HONG KONG DOLLAR) Get historic exchange rates for past Hong Kong Dollar foreign expenses. Select your currencies and the date to get histroical ratetables.
GBP HISTORICAL EXCHANGE RATES (BRITISH POUND) Get historic exchange rates for past British Pound foreign expenses. Select your currencies and the date to get histroical rate tables. EXCHANGE RATE AVERAGE (BRITISH POUND, AUSTRALIAN DOLLAR Mar 1.798511 – 31 days. Apr 1.798747 – 30 days. May 1.808646 – 29 days. View GBP Rates Table. View AUD Rates Table. View GBP / AUD Graphs. View GBP / AUD Currency Calculator. 1. Configure Converter. CAD HISTORICAL EXCHANGE RATES (CANADIAN DOLLAR) Get historic exchange rates for past Canadian Dollar foreign expenses. Select your currencies and the date to get histroical rate tables. EXCHANGE RATE AVERAGE (US DOLLAR, CANADIAN DOLLAR) US Dollar Monthly average. averageYear 2021 2020 2019 2018 2017 2016 2015 2014 2013 2012 2011. Graph is being loaded Jan 1.272665 – 31 days. Feb 1.269959 – 28 days. Mar 1.257353 – 31 days. Apr 1.251245 – 30 days. May 1.216677 – 22 days. View USD Rates Table. USD HISTORICAL EXCHANGE RATES (US DOLLAR) Get historic exchange rates for past US Dollar foreign expenses. Select your currencies and the date to get histroical rate tables. USD HISTORICAL EXCHANGE RATES (US DOLLAR) Get historic exchange rates for past US Dollar foreign expenses. Select your currencies and the date to get histroical rate tables. EXCHANGE RATE AVERAGE (EURO, US DOLLAR) Monthly AverageConverterUS Dollar per 1 Euro Monthly average. averageYear 2021 2020 2019 2018 2017 2016 2015 2014 2013 2012 2011. Graph is being loaded Jan 1.110785 – 31 days. Feb 1.091858 – 29 days. Mar 1.106977 – 31 days. Apr 1.087027 – 30 days. May 1.092001 – 31 days. Jun 1.125007 – 30 days. EXCHANGE RATE AVERAGE (ISRAELI SHEKEL, US DOLLAR) May 0.284344 – 31 days. Jun 0.289205 – 30 days. Jul 0.291193 – 31 days. Aug 0.294050 – 31 days. Sep 0.292100 – 30 days. Oct 0.294491 – 31 days. Nov 0.297408 – 30 days. Dec 0.307768 – 31 days. View ILS Rates Table. IRR HISTORICAL EXCHANGE RATES (IRANIAN RIAL) Get historic exchange rates for past Iranian Rial foreign expenses. Select your currencies and the date to get histroical rate tables. EUR HISTORICAL EXCHANGE RATES (EURO) Get historic exchange rates for past Euro foreign expenses. Select your currencies and the date to get histroical rate tables. SAR HISTORICAL EXCHANGE RATES (SAUDI ARABIAN RIYAL) 1 day ago · Get historic exchange rates for past Saudi Arabian Riyal foreign expenses. Select your currencies and the date to get histroical rate tables. HUF HISTORICAL EXCHANGE RATES (HUNGARIAN FORINT) 22 hours ago · Get historic exchange rates for past Hungarian Forint foreign expenses. Select your currencies and the date to get histroical rate tables.EXCHANGE RATES
Free foreign exchange rates and tools including a currency conversion calculator, historical rates and graphs, and a monthly exchange rateaverage.
EXCHANGE RATE AVERAGE (US DOLLAR, CANADIAN DOLLAR) US Dollar Monthly average. averageYear 2021 2020 2019 2018 2017 2016 2015 2014 2013 2012 2011. Graph is being loaded Jan 1.272665 – 31 days. Feb 1.269959 – 28 days. Mar 1.257353 – 31 days. Apr 1.251245 – 30 days. May 1.216677 – 22 days. View USD Rates Table. USD HISTORICAL EXCHANGE RATES (US DOLLAR) Get historic exchange rates for past US Dollar foreign expenses. Select your currencies and the date to get histroical rate tables. EXCHANGE RATE AVERAGE (EURO, US DOLLAR) Monthly AverageConverterUS Dollar per 1 Euro Monthly average. averageYear 2021 2020 2019 2018 2017 2016 2015 2014 2013 2012 2011. Graph is being loaded Jan 1.216983 – 31 days. Feb 1.209595 – 28 days. Mar 1.191048 – 31 days. Apr 1.195110 – 30 days. May 1.213595 – 30 days. View EUR Rates Table. EXCHANGE RATE AVERAGE (US DOLLAR, EURO) Monthly AverageConverterEuro per 1 US Dollar Monthly average. averageYear 2021 2020 2019 2018 2017 2016 2015 2014 2013 2012 2011. Graph is being loaded Jan 0.821704 – 31 days. Feb 0.826723 – 28 days. Mar 0.839597 – 31 days. Apr 0.836743 – 30 days. May 0.825950 – 22 days. View USD Rates Table. EXCHANGE RATE AVERAGE (EURO, BRITISH POUND) Monthly AverageConverterBritish Pound per 1 Euro Monthly average. averageYear 2021 2020 2019 2018 2017 2016 2015 2014 2013 2012 2011. Graph is being loaded Jan 0.892395 – 31 days. Feb 0.872511 – 28 days. Mar 0.859129 – 31 days. Apr 0.863840 – 30 days. May 0.863523 – 29 days. View EUR Rates Table. JPY HISTORICAL EXCHANGE RATES (JAPANESE YEN) Get historic exchange rates for past Japanese Yen foreign expenses. Select your currencies and the date to get histroical rate tables. HKD HISTORICAL EXCHANGE RATES (HONG KONG DOLLAR) Get historic exchange rates for past Hong Kong Dollar foreign expenses. Select your currencies and the date to get histroical ratetables.
GBP HISTORICAL EXCHANGE RATES (BRITISH POUND) Get historic exchange rates for past British Pound foreign expenses. Select your currencies and the date to get histroical rate tables. EXCHANGE RATE AVERAGE (BRITISH POUND, AUSTRALIAN DOLLAR Mar 1.798511 – 31 days. Apr 1.798747 – 30 days. May 1.808646 – 29 days. View GBP Rates Table. View AUD Rates Table. View GBP / AUD Graphs. View GBP / AUD Currency Calculator. 1. Configure Converter.EXCHANGE RATES
Free foreign exchange rates and tools including a currency conversion calculator, historical rates and graphs, and a monthly exchange rateaverage.
EXCHANGE RATE AVERAGE (US DOLLAR, CANADIAN DOLLAR) US Dollar Monthly average. averageYear 2021 2020 2019 2018 2017 2016 2015 2014 2013 2012 2011. Graph is being loaded Jan 1.272665 – 31 days. Feb 1.269959 – 28 days. Mar 1.257353 – 31 days. Apr 1.251245 – 30 days. May 1.216677 – 22 days. View USD Rates Table. USD HISTORICAL EXCHANGE RATES (US DOLLAR) Get historic exchange rates for past US Dollar foreign expenses. Select your currencies and the date to get histroical rate tables. EXCHANGE RATE AVERAGE (EURO, US DOLLAR) Monthly AverageConverterUS Dollar per 1 Euro Monthly average. averageYear 2021 2020 2019 2018 2017 2016 2015 2014 2013 2012 2011. Graph is being loaded Jan 1.216983 – 31 days. Feb 1.209595 – 28 days. Mar 1.191048 – 31 days. Apr 1.195110 – 30 days. May 1.213595 – 30 days. View EUR Rates Table. EXCHANGE RATE AVERAGE (US DOLLAR, EURO) Monthly AverageConverterEuro per 1 US Dollar Monthly average. averageYear 2021 2020 2019 2018 2017 2016 2015 2014 2013 2012 2011. Graph is being loaded Jan 0.821704 – 31 days. Feb 0.826723 – 28 days. Mar 0.839597 – 31 days. Apr 0.836743 – 30 days. May 0.825950 – 22 days. View USD Rates Table. EXCHANGE RATE AVERAGE (EURO, BRITISH POUND) Monthly AverageConverterBritish Pound per 1 Euro Monthly average. averageYear 2021 2020 2019 2018 2017 2016 2015 2014 2013 2012 2011. Graph is being loaded Jan 0.892395 – 31 days. Feb 0.872511 – 28 days. Mar 0.859129 – 31 days. Apr 0.863840 – 30 days. May 0.863523 – 29 days. View EUR Rates Table. JPY HISTORICAL EXCHANGE RATES (JAPANESE YEN) Get historic exchange rates for past Japanese Yen foreign expenses. Select your currencies and the date to get histroical rate tables. HKD HISTORICAL EXCHANGE RATES (HONG KONG DOLLAR) Get historic exchange rates for past Hong Kong Dollar foreign expenses. Select your currencies and the date to get histroical ratetables.
GBP HISTORICAL EXCHANGE RATES (BRITISH POUND) Get historic exchange rates for past British Pound foreign expenses. Select your currencies and the date to get histroical rate tables. EXCHANGE RATE AVERAGE (BRITISH POUND, AUSTRALIAN DOLLAR Mar 1.798511 – 31 days. Apr 1.798747 – 30 days. May 1.808646 – 29 days. View GBP Rates Table. View AUD Rates Table. View GBP / AUD Graphs. View GBP / AUD Currency Calculator. 1. Configure Converter. CAD HISTORICAL EXCHANGE RATES (CANADIAN DOLLAR) Get historic exchange rates for past Canadian Dollar foreign expenses. Select your currencies and the date to get histroical rate tables. EXCHANGE RATE AVERAGE (US DOLLAR, CANADIAN DOLLAR) US Dollar Monthly average. averageYear 2021 2020 2019 2018 2017 2016 2015 2014 2013 2012 2011. Graph is being loaded Jan 1.272665 – 31 days. Feb 1.269959 – 28 days. Mar 1.257353 – 31 days. Apr 1.251245 – 30 days. May 1.216677 – 22 days. View USD Rates Table. USD HISTORICAL EXCHANGE RATES (US DOLLAR) Get historic exchange rates for past US Dollar foreign expenses. Select your currencies and the date to get histroical rate tables. USD HISTORICAL EXCHANGE RATES (US DOLLAR) Get historic exchange rates for past US Dollar foreign expenses. Select your currencies and the date to get histroical rate tables. EXCHANGE RATE AVERAGE (EURO, US DOLLAR) Monthly AverageConverterUS Dollar per 1 Euro Monthly average. averageYear 2021 2020 2019 2018 2017 2016 2015 2014 2013 2012 2011. Graph is being loaded Jan 1.110785 – 31 days. Feb 1.091858 – 29 days. Mar 1.106977 – 31 days. Apr 1.087027 – 30 days. May 1.092001 – 31 days. Jun 1.125007 – 30 days. EXCHANGE RATE AVERAGE (ISRAELI SHEKEL, US DOLLAR) May 0.284344 – 31 days. Jun 0.289205 – 30 days. Jul 0.291193 – 31 days. Aug 0.294050 – 31 days. Sep 0.292100 – 30 days. Oct 0.294491 – 31 days. Nov 0.297408 – 30 days. Dec 0.307768 – 31 days. View ILS Rates Table. IRR HISTORICAL EXCHANGE RATES (IRANIAN RIAL) Get historic exchange rates for past Iranian Rial foreign expenses. Select your currencies and the date to get histroical rate tables. EUR HISTORICAL EXCHANGE RATES (EURO) Get historic exchange rates for past Euro foreign expenses. Select your currencies and the date to get histroical rate tables. SAR HISTORICAL EXCHANGE RATES (SAUDI ARABIAN RIYAL) 1 day ago · Get historic exchange rates for past Saudi Arabian Riyal foreign expenses. Select your currencies and the date to get histroical rate tables. HUF HISTORICAL EXCHANGE RATES (HUNGARIAN FORINT) 19 hours ago · Get historic exchange rates for past Hungarian Forint foreign expenses. Select your currencies and the date to get histroical rate tables.EXCHANGE RATES
Free foreign exchange rates and tools including a currency conversion calculator, historical rates and graphs, and a monthly exchange rateaverage.
EXCHANGE RATE AVERAGE (US DOLLAR, CANADIAN DOLLAR) US Dollar Monthly average. averageYear 2021 2020 2019 2018 2017 2016 2015 2014 2013 2012 2011. Graph is being loaded Jan 1.272665 – 31 days. Feb 1.269959 – 28 days. Mar 1.257353 – 31 days. Apr 1.251245 – 30 days. May 1.216677 – 22 days. View USD Rates Table. EXCHANGE RATE US DOLLAR TO EURO (CURRENCY CALCULATOR) This Free Currency Exchange Rates Calculator helps you convert US Dollar to Euro from any amount. CURRENCY EXCHANGE TABLE (US DOLLAR This currency rates table lets you compare an amount in US Dollar to all other currencies. EXCHANGE RATE AVERAGE (US DOLLAR, CHINESE YUAN RENMINBI Monthly AverageConverterChinese Yuan Renminbi per 1 US Dollar Monthly average. averageYear 2021 2020 2019 2018 2017 2016 2015 2014 2013 2012 2011. Graph is being loaded Jan 6.477917 – 31 days. Feb 6.463162 – 28 days. Mar 6.509164 – 31 days. EXCHANGE RATE AVERAGE (EURO, US DOLLAR) Monthly AverageConverterUS Dollar per 1 Euro Monthly average. averageYear 2021 2020 2019 2018 2017 2016 2015 2014 2013 2012 2011. Graph is being loaded Jan 1.110785 – 31 days. Feb 1.091858 – 29 days. Mar 1.106977 – 31 days. Apr 1.087027 – 30 days. May 1.092001 – 31 days. Jun 1.125007 – 30 days. EXCHANGE RATE AVERAGE (US DOLLAR, EURO) May 0.915750 – 31 days. Jun 0.888883 – 30 days. Jul 0.874205 – 31 days. Aug 0.845664 – 31 days. Sep 0.847918 – 30 days. Oct 0.849712 – 31 days. Nov 0.844802 – 30 days. Dec 0.822171 – 31 days. View USD Rates Table. EUR HISTORICAL EXCHANGE RATES (EURO) Get historic exchange rates for past Euro foreign expenses. Select your currencies and the date to get histroical rate tables. EXCHANGE RATE AVERAGE (EURO, BRITISH POUND) Monthly AverageConverterBritish Pound per 1 Euro Monthly average. averageYear 2021 2020 2019 2018 2017 2016 2015 2014 2013 2012 2011. Graph is being loaded Jan 0.892395 – 31 days. Feb 0.872511 – 28 days. Mar 0.859129 – 31 days. Apr 0.863840 – 30 days. May 0.863523 – 29 days. View EUR Rates Table. GBP HISTORICAL EXCHANGE RATES (BRITISH POUND) Get historic exchange rates for past British Pound foreign expenses. Select your currencies and the date to get histroical rate tables.EXCHANGE RATES
Free foreign exchange rates and tools including a currency conversion calculator, historical rates and graphs, and a monthly exchange rateaverage.
EXCHANGE RATE AVERAGE (US DOLLAR, CANADIAN DOLLAR) US Dollar Monthly average. averageYear 2021 2020 2019 2018 2017 2016 2015 2014 2013 2012 2011. Graph is being loaded Jan 1.272665 – 31 days. Feb 1.269959 – 28 days. Mar 1.257353 – 31 days. Apr 1.251245 – 30 days. May 1.216677 – 22 days. View USD Rates Table. EXCHANGE RATE US DOLLAR TO EURO (CURRENCY CALCULATOR) This Free Currency Exchange Rates Calculator helps you convert US Dollar to Euro from any amount. CURRENCY EXCHANGE TABLE (US DOLLAR This currency rates table lets you compare an amount in US Dollar to all other currencies. EXCHANGE RATE AVERAGE (US DOLLAR, CHINESE YUAN RENMINBI Monthly AverageConverterChinese Yuan Renminbi per 1 US Dollar Monthly average. averageYear 2021 2020 2019 2018 2017 2016 2015 2014 2013 2012 2011. Graph is being loaded Jan 6.477917 – 31 days. Feb 6.463162 – 28 days. Mar 6.509164 – 31 days. EXCHANGE RATE AVERAGE (EURO, US DOLLAR) Monthly AverageConverterUS Dollar per 1 Euro Monthly average. averageYear 2021 2020 2019 2018 2017 2016 2015 2014 2013 2012 2011. Graph is being loaded Jan 1.110785 – 31 days. Feb 1.091858 – 29 days. Mar 1.106977 – 31 days. Apr 1.087027 – 30 days. May 1.092001 – 31 days. Jun 1.125007 – 30 days. EXCHANGE RATE AVERAGE (US DOLLAR, EURO) May 0.915750 – 31 days. Jun 0.888883 – 30 days. Jul 0.874205 – 31 days. Aug 0.845664 – 31 days. Sep 0.847918 – 30 days. Oct 0.849712 – 31 days. Nov 0.844802 – 30 days. Dec 0.822171 – 31 days. View USD Rates Table. EUR HISTORICAL EXCHANGE RATES (EURO) Get historic exchange rates for past Euro foreign expenses. Select your currencies and the date to get histroical rate tables. EXCHANGE RATE AVERAGE (US DOLLAR, CANADIAN DOLLAR) Jul 1.351504 – 31 days. Aug 1.325145 – 31 days. Sep 1.320815 – 30 days. Oct 1.320838 – 31 days. Nov 1.308897 – 30 days. Dec 1.281532 – 31 days. View USD Rates Table. View CAD Rates Table. ViewUSD / CAD Graphs.
EXCHANGE RATE AVERAGE (CANADIAN DOLLAR, US DOLLAR) Jun 0.751666 – 30 days. Jul 0.763631 – 31 days. Aug 0.753944 – 31 days. Sep 0.755178 – 30 days. Oct 0.758146 – 31 days. Nov 0.755730 – 30 days. Dec 0.758842 – 31 CAD HISTORICAL EXCHANGE RATES (CANADIAN DOLLAR) Get historic exchange rates for past Canadian Dollar foreign expenses. Select your currencies and the date to get histroical rate tables. USD HISTORICAL EXCHANGE RATES (US DOLLAR) Get historic exchange rates for past US Dollar foreign expenses. Select your currencies and the date to get histroical rate tables. EXCHANGE RATE AVERAGE (US DOLLAR, EURO) May 0.915750 – 31 days. Jun 0.888883 – 30 days. Jul 0.874205 – 31 days. Aug 0.845664 – 31 days. Sep 0.847918 – 30 days. Oct 0.849712 – 31 days. Nov 0.844802 – 30 days. Dec 0.822171 – 31 days. View USD Rates Table. EXCHANGE RATE AVERAGE (EURO, US DOLLAR) Monthly AverageConverterUS Dollar per 1 Euro Monthly average. averageYear 2021 2020 2019 2018 2017 2016 2015 2014 2013 2012 2011. Graph is being loaded Jan 1.110785 – 31 days. Feb 1.091858 – 29 days. Mar 1.106977 – 31 days. Apr 1.087027 – 30 days. May 1.092001 – 31 days. Jun 1.125007 – 30 days. HKD HISTORICAL EXCHANGE RATES (HONG KONG DOLLAR) 11 hours ago · Get historic exchange rates for past Hong Kong Dollar foreign expenses. Select your currencies and the date to get histroical rate tables. IRR HISTORICAL EXCHANGE RATES (IRANIAN RIAL) Get historic exchange rates for past Iranian Rial foreign expenses. Select your currencies and the date to get histroical rate tables. SAR HISTORICAL EXCHANGE RATES (SAUDI ARABIAN RIYAL) 1 day ago · Get historic exchange rates for past Saudi Arabian Riyal foreign expenses. Select your currencies and the date to get histroical rate tables. HUF HISTORICAL EXCHANGE RATES (HUNGARIAN FORINT) 10 hours ago · Get historic exchange rates for past Hungarian Forint foreign expenses. Select your currencies and the date to get histroical rate tables.EXCHANGE RATES
Free foreign exchange rates and tools including a currency conversion calculator, historical rates and graphs, and a monthly exchange rateaverage.
EXCHANGE RATE US DOLLAR TO EURO (CURRENCY CALCULATOR) This Free Currency Exchange Rates Calculator helps you convert US Dollar to Euro from any amount. USD HISTORICAL EXCHANGE RATES (US DOLLAR) Get historic exchange rates for past US Dollar foreign expenses. Select your currencies and the date to get histroical rate tables. EXCHANGE RATE AVERAGE (US DOLLAR, MEXICAN PESO) Jun 22.311231 – 30 days. Jul 22.422294 – 31 days. Aug 22.165531 – 31 days. Sep 21.625680 – 30 days. Oct 21.276066 – 31 days. Nov 20.428621 – 30 days. Dec 19.958868 – 31 days. View USD Rates Table. View MXN Rates Table. EXCHANGE RATE AVERAGE (US DOLLAR, THAI BAHT) Monthly AverageConverterThai Baht per 1 US Dollar Monthly average. averageYear 2021 2020 2019 2018 2017 2016 2015 2014 2013 2012 2011. Graph is being loaded Jan 30.370095 – 31 days. Feb 31.331395 – 29 days. Mar 32.031461 – 31 days. Apr 32.649029 – 30 days. May 32.086505 – 31 days. Jun 31.174680 – 30 days. EXCHANGE RATE AVERAGE (US DOLLAR, INDIAN RUPEE) Jan 70.631569 – 31 days. Feb 71.228669 – 28 days. Mar 69.657579 – 31 days. Apr 69.430437 – 30 days. May 69.794743 – 31 days. Jun 69.489345 – 30 days. Jul 68.764510 – 31 days. Aug 71.105039 – 31 days. Sep 71.381213 – 30 days. EXCHANGE RATE AVERAGE (EURO, SOUTH AFRICAN RAND) Monthly AverageConverterSouth African Rand per 1 Euro Monthly average. averageYear 2021 2020 2019 2018 2017 2016 2015 2014 2013 2012 2011. Graph is being loaded Jan 15.965692 – 31 days. Feb 16.409973 – 29 days. Mar 18.412814 – 31 days. EXCHANGE RATE AVERAGE (US DOLLAR, SOUTH KOREAN WON) Jun 1173.534085 – 30 days. Jul 1176.076353 – 31 days. Aug 1209.256586 – 31 days. Sep 1194.862870 – 30 days. Oct 1183.385707 – 31 days. Nov 1167.862358 – 30 days. Dec 1172.792302 – 31 days. View USD Rates Table. EXCHANGE RATE AVERAGE (BRITISH POUND, EURO) May 1.126577 – 31 days. Jun 1.112188 – 30 days. Jul 1.105288 – 31 days. Aug 1.110332 – 31 days. Sep 1.099123 – 30 days. Oct 1.102623 – 31 days. Nov 1.115376 – 30 days. Dec 1.103864 – 31 days. View GBP Rates Table. EXCHANGE RATE AVERAGE (PHILIPPINE PESO, CANADIAN DOLLAR Jul 0.024591 – 31 days. Aug 0.024486 – 31 days. Sep 0.024150 – 30 days. Oct 0.024109 – 31 days. Nov 0.024983 – 30 days. Dec 0.025460 – 31 days. View PHP Rates Table. View CAD Rates Table. ViewPHP / CAD Graphs.
EXCHANGE RATES
Free foreign exchange rates and tools including a currency conversion calculator, historical rates and graphs, and a monthly exchange rateaverage.
EXCHANGE RATE US DOLLAR TO EURO (CURRENCY CALCULATOR) This Free Currency Exchange Rates Calculator helps you convert US Dollar to Euro from any amount. USD HISTORICAL EXCHANGE RATES (US DOLLAR) Get historic exchange rates for past US Dollar foreign expenses. Select your currencies and the date to get histroical rate tables. EXCHANGE RATE AVERAGE (US DOLLAR, MEXICAN PESO) Jun 22.311231 – 30 days. Jul 22.422294 – 31 days. Aug 22.165531 – 31 days. Sep 21.625680 – 30 days. Oct 21.276066 – 31 days. Nov 20.428621 – 30 days. Dec 19.958868 – 31 days. View USD Rates Table. View MXN Rates Table. EXCHANGE RATE AVERAGE (US DOLLAR, THAI BAHT) Monthly AverageConverterThai Baht per 1 US Dollar Monthly average. averageYear 2021 2020 2019 2018 2017 2016 2015 2014 2013 2012 2011. Graph is being loaded Jan 30.370095 – 31 days. Feb 31.331395 – 29 days. Mar 32.031461 – 31 days. Apr 32.649029 – 30 days. May 32.086505 – 31 days. Jun 31.174680 – 30 days. EXCHANGE RATE AVERAGE (US DOLLAR, INDIAN RUPEE) Jan 70.631569 – 31 days. Feb 71.228669 – 28 days. Mar 69.657579 – 31 days. Apr 69.430437 – 30 days. May 69.794743 – 31 days. Jun 69.489345 – 30 days. Jul 68.764510 – 31 days. Aug 71.105039 – 31 days. Sep 71.381213 – 30 days. EXCHANGE RATE AVERAGE (EURO, SOUTH AFRICAN RAND) Monthly AverageConverterSouth African Rand per 1 Euro Monthly average. averageYear 2021 2020 2019 2018 2017 2016 2015 2014 2013 2012 2011. Graph is being loaded Jan 15.965692 – 31 days. Feb 16.409973 – 29 days. Mar 18.412814 – 31 days. EXCHANGE RATE AVERAGE (US DOLLAR, SOUTH KOREAN WON) Jun 1173.534085 – 30 days. Jul 1176.076353 – 31 days. Aug 1209.256586 – 31 days. Sep 1194.862870 – 30 days. Oct 1183.385707 – 31 days. Nov 1167.862358 – 30 days. Dec 1172.792302 – 31 days. View USD Rates Table. EXCHANGE RATE AVERAGE (BRITISH POUND, EURO) May 1.126577 – 31 days. Jun 1.112188 – 30 days. Jul 1.105288 – 31 days. Aug 1.110332 – 31 days. Sep 1.099123 – 30 days. Oct 1.102623 – 31 days. Nov 1.115376 – 30 days. Dec 1.103864 – 31 days. View GBP Rates Table. EXCHANGE RATE AVERAGE (PHILIPPINE PESO, CANADIAN DOLLAR Jul 0.024591 – 31 days. Aug 0.024486 – 31 days. Sep 0.024150 – 30 days. Oct 0.024109 – 31 days. Nov 0.024983 – 30 days. Dec 0.025460 – 31 days. View PHP Rates Table. View CAD Rates Table. ViewPHP / CAD Graphs.
EXCHANGE RATE US DOLLAR TO EURO (CURRENCY CALCULATOR) This Free Currency Exchange Rates Calculator helps you convert US Dollar to Euro from any amount. CURRENCY EXCHANGE TABLE (US DOLLAR This currency rates table lets you compare an amount in US Dollar to all other currencies. EXCHANGE RATE AVERAGE (US DOLLAR, CHINESE YUAN RENMINBI Monthly AverageConverterChinese Yuan Renminbi per 1 US Dollar Monthly average. averageYear 2021 2020 2019 2018 2017 2016 2015 2014 2013 2012 2011. Graph is being loaded Jan 6.477917 – 31 days. Feb 6.463162 – 28 days. Mar 6.509164 – 31 days. EXCHANGE RATE AVERAGE (US DOLLAR, BRITISH POUND) May 0.812860 – 31 days. Jun 0.799220 – 30 days. Jul 0.790929 – 31 days. Aug 0.761631 – 31 days. Sep 0.771449 – 30 days. Oct 0.770628 – 31 days. Nov 0.757414 – 30 days. Dec 0.744812 – 31 days. View USD Rates Table. EXCHANGE RATE AVERAGE (ISRAELI SHEKEL, US DOLLAR) May 0.284344 – 31 days. Jun 0.289205 – 30 days. Jul 0.291193 – 31 days. Aug 0.294050 – 31 days. Sep 0.292100 – 30 days. Oct 0.294491 – 31 days. Nov 0.297408 – 30 days. Dec 0.307768 – 31 days. View ILS Rates Table. USD HISTORICAL EXCHANGE RATES (US DOLLAR) Get historic exchange rates for past US Dollar foreign expenses. Select your currencies and the date to get histroical rate tables. EXCHANGE RATE AVERAGE (US DOLLAR, SINGAPORE DOLLAR) Apr 1.423848 – 30 days. May 1.418816 – 31 days. Jun 1.394449 – 30 days. Jul 1.388248 – 31 days. Aug 1.369714 – 31 days. Sep 1.366247 – 30 days. Oct 1.359801 – 31 days. Nov 1.347660 – 30 days. Dec 1.332838 – 31 days. EXCHANGE RATE AVERAGE (US DOLLAR, CANADIAN DOLLAR) Jun 1.311300 – 30 days. Jul 1.313156 – 31 days. Aug 1.304298 – 31 days. Sep 1.303159 – 30 days. Oct 1.301005 – 31 days. Nov 1.318985 – 30 days. Dec 1.344400 – 31 days. View USD Rates Table. View CAD Rates Table. EXCHANGE RATE AVERAGE (BRITISH POUND, EURO) May 1.126577 – 31 days. Jun 1.112188 – 30 days. Jul 1.105288 – 31 days. Aug 1.110332 – 31 days. Sep 1.099123 – 30 days. Oct 1.102623 – 31 days. Nov 1.115376 – 30 days. Dec 1.103864 – 31 days. View GBP Rates Table. EXCHANGE RATE AVERAGE (BRITISH POUND, EURO) Monthly AverageConverterEuro per 1 British Pound Monthly average. averageYear 2021 2020 2019 2018 2017 2016 2015 2014 2013 2012 2011. Graph is being loaded Jan 1.128716 – 31 days. Feb 1.145218 – 28 days. Mar 1.165590 – 31 days. Apr 1.158961 – 30 days. MayEXCHANGE RATES
Free foreign exchange rates and tools including a currency conversion calculator, historical rates and graphs, and a monthly exchange rateaverage.
EXCHANGE RATE US DOLLAR TO EURO (CURRENCY CALCULATOR) This Free Currency Exchange Rates Calculator helps you convert US Dollar to Euro from any amount. USD HISTORICAL EXCHANGE RATES (US DOLLAR) Get historic exchange rates for past US Dollar foreign expenses. Select your currencies and the date to get histroical rate tables. EXCHANGE RATE AVERAGE (US DOLLAR, MEXICAN PESO) Jun 22.311231 – 30 days. Jul 22.422294 – 31 days. Aug 22.165531 – 31 days. Sep 21.625680 – 30 days. Oct 21.276066 – 31 days. Nov 20.428621 – 30 days. Dec 19.958868 – 31 days. View USD Rates Table. View MXN Rates Table. EXCHANGE RATE AVERAGE (US DOLLAR, THAI BAHT) Monthly AverageConverterThai Baht per 1 US Dollar Monthly average. averageYear 2021 2020 2019 2018 2017 2016 2015 2014 2013 2012 2011. Graph is being loaded Jan 30.370095 – 31 days. Feb 31.331395 – 29 days. Mar 32.031461 – 31 days. Apr 32.649029 – 30 days. May 32.086505 – 31 days. Jun 31.174680 – 30 days. EXCHANGE RATE AVERAGE (US DOLLAR, INDIAN RUPEE) Jan 70.631569 – 31 days. Feb 71.228669 – 28 days. Mar 69.657579 – 31 days. Apr 69.430437 – 30 days. May 69.794743 – 31 days. Jun 69.489345 – 30 days. Jul 68.764510 – 31 days. Aug 71.105039 – 31 days. Sep 71.381213 – 30 days. EXCHANGE RATE AVERAGE (EURO, SOUTH AFRICAN RAND) Monthly AverageConverterSouth African Rand per 1 Euro Monthly average. averageYear 2021 2020 2019 2018 2017 2016 2015 2014 2013 2012 2011. Graph is being loaded Jan 15.965692 – 31 days. Feb 16.409973 – 29 days. Mar 18.412814 – 31 days. EXCHANGE RATE AVERAGE (US DOLLAR, SOUTH KOREAN WON) Jun 1173.534085 – 30 days. Jul 1176.076353 – 31 days. Aug 1209.256586 – 31 days. Sep 1194.862870 – 30 days. Oct 1183.385707 – 31 days. Nov 1167.862358 – 30 days. Dec 1172.792302 – 31 days. View USD Rates Table. EXCHANGE RATE AVERAGE (BRITISH POUND, EURO) May 1.126577 – 31 days. Jun 1.112188 – 30 days. Jul 1.105288 – 31 days. Aug 1.110332 – 31 days. Sep 1.099123 – 30 days. Oct 1.102623 – 31 days. Nov 1.115376 – 30 days. Dec 1.103864 – 31 days. View GBP Rates Table. EXCHANGE RATE AVERAGE (PHILIPPINE PESO, CANADIAN DOLLAR Jul 0.024591 – 31 days. Aug 0.024486 – 31 days. Sep 0.024150 – 30 days. Oct 0.024109 – 31 days. Nov 0.024983 – 30 days. Dec 0.025460 – 31 days. View PHP Rates Table. View CAD Rates Table. ViewPHP / CAD Graphs.
EXCHANGE RATES
Free foreign exchange rates and tools including a currency conversion calculator, historical rates and graphs, and a monthly exchange rateaverage.
EXCHANGE RATE US DOLLAR TO EURO (CURRENCY CALCULATOR) This Free Currency Exchange Rates Calculator helps you convert US Dollar to Euro from any amount. USD HISTORICAL EXCHANGE RATES (US DOLLAR) Get historic exchange rates for past US Dollar foreign expenses. Select your currencies and the date to get histroical rate tables. EXCHANGE RATE AVERAGE (US DOLLAR, MEXICAN PESO) Jun 22.311231 – 30 days. Jul 22.422294 – 31 days. Aug 22.165531 – 31 days. Sep 21.625680 – 30 days. Oct 21.276066 – 31 days. Nov 20.428621 – 30 days. Dec 19.958868 – 31 days. View USD Rates Table. View MXN Rates Table. EXCHANGE RATE AVERAGE (US DOLLAR, THAI BAHT) Monthly AverageConverterThai Baht per 1 US Dollar Monthly average. averageYear 2021 2020 2019 2018 2017 2016 2015 2014 2013 2012 2011. Graph is being loaded Jan 30.370095 – 31 days. Feb 31.331395 – 29 days. Mar 32.031461 – 31 days. Apr 32.649029 – 30 days. May 32.086505 – 31 days. Jun 31.174680 – 30 days. EXCHANGE RATE AVERAGE (US DOLLAR, INDIAN RUPEE) Jan 70.631569 – 31 days. Feb 71.228669 – 28 days. Mar 69.657579 – 31 days. Apr 69.430437 – 30 days. May 69.794743 – 31 days. Jun 69.489345 – 30 days. Jul 68.764510 – 31 days. Aug 71.105039 – 31 days. Sep 71.381213 – 30 days. EXCHANGE RATE AVERAGE (EURO, SOUTH AFRICAN RAND) Monthly AverageConverterSouth African Rand per 1 Euro Monthly average. averageYear 2021 2020 2019 2018 2017 2016 2015 2014 2013 2012 2011. Graph is being loaded Jan 15.965692 – 31 days. Feb 16.409973 – 29 days. Mar 18.412814 – 31 days. EXCHANGE RATE AVERAGE (US DOLLAR, SOUTH KOREAN WON) Jun 1173.534085 – 30 days. Jul 1176.076353 – 31 days. Aug 1209.256586 – 31 days. Sep 1194.862870 – 30 days. Oct 1183.385707 – 31 days. Nov 1167.862358 – 30 days. Dec 1172.792302 – 31 days. View USD Rates Table. EXCHANGE RATE AVERAGE (BRITISH POUND, EURO) May 1.126577 – 31 days. Jun 1.112188 – 30 days. Jul 1.105288 – 31 days. Aug 1.110332 – 31 days. Sep 1.099123 – 30 days. Oct 1.102623 – 31 days. Nov 1.115376 – 30 days. Dec 1.103864 – 31 days. View GBP Rates Table. EXCHANGE RATE AVERAGE (PHILIPPINE PESO, CANADIAN DOLLAR Jul 0.024591 – 31 days. Aug 0.024486 – 31 days. Sep 0.024150 – 30 days. Oct 0.024109 – 31 days. Nov 0.024983 – 30 days. Dec 0.025460 – 31 days. View PHP Rates Table. View CAD Rates Table. ViewPHP / CAD Graphs.
EXCHANGE RATE US DOLLAR TO EURO (CURRENCY CALCULATOR) This Free Currency Exchange Rates Calculator helps you convert US Dollar to Euro from any amount. CURRENCY EXCHANGE TABLE (US DOLLAR This currency rates table lets you compare an amount in US Dollar to all other currencies. EXCHANGE RATE AVERAGE (US DOLLAR, CHINESE YUAN RENMINBI Monthly AverageConverterChinese Yuan Renminbi per 1 US Dollar Monthly average. averageYear 2021 2020 2019 2018 2017 2016 2015 2014 2013 2012 2011. Graph is being loaded Jan 6.477917 – 31 days. Feb 6.463162 – 28 days. Mar 6.509164 – 31 days. EXCHANGE RATE AVERAGE (US DOLLAR, BRITISH POUND) May 0.812860 – 31 days. Jun 0.799220 – 30 days. Jul 0.790929 – 31 days. Aug 0.761631 – 31 days. Sep 0.771449 – 30 days. Oct 0.770628 – 31 days. Nov 0.757414 – 30 days. Dec 0.744812 – 31 days. View USD Rates Table. EXCHANGE RATE AVERAGE (ISRAELI SHEKEL, US DOLLAR) May 0.284344 – 31 days. Jun 0.289205 – 30 days. Jul 0.291193 – 31 days. Aug 0.294050 – 31 days. Sep 0.292100 – 30 days. Oct 0.294491 – 31 days. Nov 0.297408 – 30 days. Dec 0.307768 – 31 days. View ILS Rates Table. USD HISTORICAL EXCHANGE RATES (US DOLLAR) Get historic exchange rates for past US Dollar foreign expenses. Select your currencies and the date to get histroical rate tables. EXCHANGE RATE AVERAGE (US DOLLAR, SINGAPORE DOLLAR) Apr 1.423848 – 30 days. May 1.418816 – 31 days. Jun 1.394449 – 30 days. Jul 1.388248 – 31 days. Aug 1.369714 – 31 days. Sep 1.366247 – 30 days. Oct 1.359801 – 31 days. Nov 1.347660 – 30 days. Dec 1.332838 – 31 days. EXCHANGE RATE AVERAGE (US DOLLAR, CANADIAN DOLLAR) Jun 1.311300 – 30 days. Jul 1.313156 – 31 days. Aug 1.304298 – 31 days. Sep 1.303159 – 30 days. Oct 1.301005 – 31 days. Nov 1.318985 – 30 days. Dec 1.344400 – 31 days. View USD Rates Table. View CAD Rates Table. EXCHANGE RATE AVERAGE (BRITISH POUND, EURO) May 1.126577 – 31 days. Jun 1.112188 – 30 days. Jul 1.105288 – 31 days. Aug 1.110332 – 31 days. Sep 1.099123 – 30 days. Oct 1.102623 – 31 days. Nov 1.115376 – 30 days. Dec 1.103864 – 31 days. View GBP Rates Table. EXCHANGE RATE AVERAGE (BRITISH POUND, EURO) Monthly AverageConverterEuro per 1 British Pound Monthly average. averageYear 2021 2020 2019 2018 2017 2016 2015 2014 2013 2012 2011. Graph is being loaded Jan 1.128716 – 31 days. Feb 1.145218 – 28 days. Mar 1.165590 – 31 days. Apr 1.158961 – 30 days. May Skip to Main Content* Home
* Currency Calculator* Graphs
* Rates Table
* Monthly Average
* Historic Lookup
Home
1. Configure Converteramount ►
↔
2. Select Action
* ►Currency Calculator►* ►Graphs►
* ►Rates Table►
* ►Monthly Average averageYear 2019 2018 2017 2016 2015 2014 2013 2012 2011 2010 2009 * ►Historic Lookuphistorical date
USD
GBP
CAD
EUR
AUD
1
0.81842
1.33224
0.91258
1.48589
1.22187
1
1.62782
1.11505
1.81556
0.75062
0.61432
1
0.68500
1.11533
1.09580
0.89682
1.45986
1
1.62823
0.67300
0.55079
0.89659
0.61416
1
Refresh in 0:51 | Oct 09, 2019 00:48 UTCCURRENCY LIST
* Argentine Peso
* Australian Dollar
* Bahraini Dinar
* Botswana Pula
* Brazilian Real
* Bruneian Dollar
* Bulgarian Lev
* Canadian Dollar
* Chilean Peso
* Chinese Yuan Renminbi* Colombian Peso
* Croatian Kuna
* Czech Koruna
* Danish Krone
* Euro
* Hong Kong Dollar
* Hungarian Forint
* Icelandic Krona
* Indian Rupee
* Indonesian Rupiah
* Iranian Rial
* Israeli Shekel
* Japanese Yen
* Kazakhstani Tenge
* South Korean Won
* Kuwaiti Dinar
* Libyan Dinar
* Malaysian Ringgit
* Mauritian Rupee
* Mexican Peso
* Nepalese Rupee
* New Zealand Dollar* Norwegian Krone
* Omani Rial
* Pakistani Rupee
* Philippine Peso
* Polish Zloty
* Qatari Riyal
* Romanian New Leu
* Russian Ruble
* Saudi Arabian Riyal* Singapore Dollar
* South African Rand* Sri Lankan Rupee
* Swedish Krona
* Swiss Franc
* Taiwan New Dollar
* Thai Baht
* Trinidadian Dollar* Turkish Lira
* Emirati Dirham
* British Pound
* US Dollar
* Venezuelan Bolivar PERCENT CHANGE IN THE LAST 24 HOURS* EUR/USD-0.10525%
* USD/JPY-0.28977%
* GBP/USD-0.56938%
* USD/CHF-0.25830%
* USD/CAD+0.12454%
* EUR/JPY-0.39471%
* AUD/USD-0.00823%
* CNY/USD+0.05724%
Oct 09, 2019 00:48 UTCAD
USEFUL LINKS
* Euro Information
* FAQ
* Feedback
* Terms of Service
* Privacy
* Cookie Policy
* Advertise on X-Rates* Feedback
* FAQ
� X-Rates 2019
Details
3