2
More Annotations


6


1
Favourite Annotations


4


5
Text
WWLLN - THE WORLD WIDE LIGHTNING LOCATION NETWORKLIGHTNING CLIMATOLOGYGLOBAL MONITORPEER REVIEWED PUBLICATIONSWWLLN.NET/STORMS The WWLLN Management Team, lead by Prof Robert Holzworth of the University of Washington produced these data and images with the cooperation of the universities and institutes which host the stations as listed below. Wideband VLF spectrograms from all WWLLN stations are available this link or by clicking on the station name below. We currently have over 70 sensors around the globe to detect
STORM SELECT PAGE
Tropical Cyclones Data for 1152 storms from Nov. 13, 2009 to Dec. 2,2020
WWLLN LIGHTNING CLIMATOLOGY ANIMATIONSLIGHTNING RADIO NETWORKWWLLN LIGHTNING NETWORKGLOBAL LIGHTNING NETWORKLIGHTNING DETECTION WEBSITEGLOBAL LIGHTNING TRACKERLIGHTNING DETECTION NETWORK The ground-based World-Wide Lightning Location Network ( WWLLN) continuously monitors global lightning. Below are links to lightning climatology maps and animations of its diurnal cycle, based on four years (2008-2011) of WWLLN data. For all maps, units are strokes km-2 yr-1; all months are included (unless otherwise specified); gray lines TOGA NETWORK GLOBAL LIGHTNING MAPS Lightning activity for Earth Lightning stroke positions are shown as coloured dots which "cool down" from blue for the most recent (occurring within the last 10 min) through green and yellow to red for the oldest (30-40 minutes earlier). Red asterisks in white circles are active WWLL lightning sensor locations. WWLLN: STATION SPECTROGRAMS WWLLN: World Wide Lightning Location Network These wideband VLF spectrograms from our lightning sensors show radio atmospherics ('sferics') generated by lightning (vertical lines) and narrowband signals from VLF transmitters (horizontal lines). LIGHTNING IN WESTERN PATAGONIA Lightning in Western Patagonia René D. Garreaud1, M. Gabriela Nicora2, Rodrigo E. Bürgesser3, and Eldo E. Ávila3 1Department of Geophysics, Universidad de ChileHAROLD - WWLLN
Lightning Histogram Plot. Three plots are created. The first is of wind speed, pressure, and a histogram of the number of lightning strokes per hour for lightning within 1000 km of the storm center. The second is the same, but only for lightning within 100 km of the storm center. The third plot is a spectrogram showing the number oflightning
PRELIMINARY STUDY ON FEATURES OF LIGHTNING DISCHARGE 98 SOLA, 2014, ol. 10, 98−102, doi:10.211sola.2014-020 Abstract Features of lightning around Japan over a four-year period are described using World Wide Lightning Location Network data based on global observations of very low frequency radio waves. HIGHLIGHTS OF A NEW GROUND-BASED, HOURLY GLOBAL … The ground-based World Wide Lightning Location Network (WWLLN) provides unprecedented sampling of lightning frequency, providing a basis for climatologies LIGHTNING GENERATED WHISTLER WAVES OBSERVED BY PROBES ON In addition to these direct, in situ observations of light-ning in the ionosphere, recent measurements from satellites of terrestrial gamma radiation sources [e.g., Fishman et al., WWLLN - THE WORLD WIDE LIGHTNING LOCATION NETWORKLIGHTNING CLIMATOLOGYGLOBAL MONITORPEER REVIEWED PUBLICATIONSWWLLN.NET/STORMS The WWLLN Management Team, lead by Prof Robert Holzworth of the University of Washington produced these data and images with the cooperation of the universities and institutes which host the stations as listed below. Wideband VLF spectrograms from all WWLLN stations are available this link or by clicking on the station name below. We currently have over 70 sensors around the globe to detectSTORM SELECT PAGE
Tropical Cyclones Data for 1152 storms from Nov. 13, 2009 to Dec. 2,2020
WWLLN LIGHTNING CLIMATOLOGY ANIMATIONSLIGHTNING RADIO NETWORKWWLLN LIGHTNING NETWORKGLOBAL LIGHTNING NETWORKLIGHTNING DETECTION WEBSITEGLOBAL LIGHTNING TRACKERLIGHTNING DETECTION NETWORK GLOBAL and REGIONAL LIGHTNING CLIMATOLOGY BASED ON WWLLN DATA FROM 2008 TO PRESENT. These movies and plots were prepared by K. S. Virts working in collaboration with M. L. Hutchins, J. M. Wallace and R. H.Holzworth
TOGA NETWORK GLOBAL LIGHTNING MAPS Lightning activity for Earth Lightning stroke positions are shown as coloured dots which "cool down" from blue for the most recent (occurring within the last 10 min) through green and yellow to red for the oldest (30-40 minutes earlier). Red asterisks in white circles are active WWLL lightning sensor locations. WWLLN: STATION SPECTROGRAMS WWLLN: World Wide Lightning Location Network These wideband VLF spectrograms from our lightning sensors show radio atmospherics ('sferics') generated by lightning (vertical lines) and narrowband signals from VLF transmitters (horizontal lines).HAROLD - WWLLN
Harold March 31, 2020 to April 11, 2020 Duration: 1 week, 4 days Number of Track Records: 43 LIGHTNING IN WESTERN PATAGONIA Lightning in Western Patagonia René D. Garreaud1, M. Gabriela Nicora2, Rodrigo E. Bürgesser3, and Eldo E. Ávila3 1Department of Geophysics, Universidad de Chile PRELIMINARY STUDY ON FEATURES OF LIGHTNING DISCHARGE 98 SOLA, 2014, ol. 10, 98−102, doi:10.211sola.2014-020 Abstract Features of lightning around Japan over a four-year period are described using World Wide Lightning Location Network data based on global observations of very low frequency radio waves. HIGHLIGHTS OF A NEW GROUND-BASED, HOURLY GLOBAL … The ground-based World Wide Lightning Location Network (WWLLN) provides unprecedented sampling of lightning frequency, providing a basis for climatologies LIGHTNING GENERATED WHISTLER WAVES OBSERVED BY PROBES ON In addition to these direct, in situ observations of light-ning in the ionosphere, recent measurements from satellites of terrestrial gamma radiation sources [e.g., Fishman et al.,WWLLN PUBLICATIONS
WWLLN Publications (These articles each depend on WWLLN data) Note to Authors: Please include this statement in your papers using WWLLN data: "Acknowledgement: The WWLLN: STATION SPECTROGRAMS WWLLN: World Wide Lightning Location Network These wideband VLF spectrograms from our lightning sensors show radio atmospherics ('sferics') generated by lightning (vertical lines) and narrowband signals from VLF transmitters (horizontal lines).STORM GROUP PAGE
Name TC Season Region Storm Number Start Date End Date Duration; Amphan: 20: IO: 1: May 15, 2020: May 21, 2020: 6 days: View: Burevi: 20: IO: 5: Nov. 27, 2020: Dec. 2STORM GROUP PAGE
Name TC Season Region Storm Number Start Date End Date Duration; Ema: 19: CPAC: 1: Oct. 11, 2019: Oct. 16, 2019: 5 days: View RELATIVE DETECTION EFFICIENCY OF THE WORLD WIDE LIGHTNING Relative detection efficiency of the World Wide Lightning Location Network M. L. Hutchins,1 R. H. Holzworth,1 J. B. Brundell,2 and C. J. Rodger3 Received 18 May 2012; revised 18 October 2012; accepted 25 October 2012; published 13 December 2012. AN EVALUATION OF THE WORLDWIDE LIGHTNING LOCATION NETWORK An evaluation of the Worldwide Lightning Location Network (WWLLN) using the National Lightning Detection Network (NLDN) as ground truth Sergio F. Abarca,1 Kristen L. Corbosiero,1 and Thomas J. Galarneau Jr.2 Received 19 October 2009; revised 24 May 2010; accepted 2 June 2010; published 22 September 2010. PRELIMINARY STUDY ON FEATURES OF LIGHTNING DISCHARGE 98 SOLA, 2014, ol. 10, 98−102, doi:10.211sola.2014-020 Abstract Features of lightning around Japan over a four-year period are described using World Wide Lightning Location Network data based on global observations of very low frequency radio waves. WWLL GLOBAL LIGHTNING DETECTION SYSTEM: REGIONAL WWLL global lightning detection system: Regional validation study in Brazil Erin H. Lay,1,2 Robert H. Holzworth,1 Craig J. Rodger,3 Jeremy N. Thomas,1 Osmar Pinto Jr.,4 and Richard L. Dowden5 Received 20 October 2003; revised 2 December 2003; accepted 17 December 2003; published 3 February 2004. UNDERSTANDING THE RELATIONSHIPS BETWEEN LIGHTNING, CLOUD Understanding the Relationships between Lightning, Cloud Microphysics, and Airborne Radar-Derived Storm Structure during Hurricane Karl (2010) BRAD REINHART,* HENRY FUELBERG,* RICHARD BLAKESLEE,1 DOUGLAS MACH,# ANDREW HEYMSFIELD,@ AARON BANSEMER,@ STEPHEN L. DURDEN,& SIMONE TANELLI,& GERALD HEYMSFIELD,** AND BJORN LAMBRIGTSEN& * The Florida VLF LIGHTNING LOCATION BY TIME OF GROUP ARRIVAL (TOGA) AT R.L. Dowden et al./Journal of Atmospheric and Solar-Terrestrial Physics 64 (2002) 817–830 819 110 120 130 140 150 160 170 50 45 4035 30 25 20 15 10 5
WWLLN - THE WORLD WIDE LIGHTNING LOCATION NETWORKLIGHTNING CLIMATOLOGYGLOBAL MONITORPEER REVIEWED PUBLICATIONSWWLLN.NET/STORMS The WWLLN Management Team, lead by Prof Robert Holzworth of the University of Washington produced these data and images with the cooperation of the universities and institutes which host the stations as listed below. Wideband VLF spectrograms from all WWLLN stations are available this link or by clicking on the station name below. We currently have over 70 sensors around the globe to detect TOGA NETWORK GLOBAL LIGHTNING MAPS Lightning activity for Earth Lightning stroke positions are shown as coloured dots which "cool down" from blue for the most recent (occurring within the last 10 min) through green and yellow to red for the oldest (30-40 minutes earlier). Red asterisks in white circles are active WWLL lightning sensor locations.STORM SELECT PAGE
Tropical Cyclones Data for 1152 storms from Nov. 13, 2009 to Dec. 2,2020
HAROLD - WWLLN
Harold March 31, 2020 to April 11, 2020 Duration: 1 week, 4 days Number of Track Records: 43 WWLLN LIGHTNING CLIMATOLOGY ANIMATIONS GLOBAL and REGIONAL LIGHTNING CLIMATOLOGY BASED ON WWLLN DATA FROM 2008 TO PRESENT. These movies and plots were prepared by K. S. Virts working in collaboration with M. L. Hutchins, J. M. Wallace and R. H.Holzworth
WWLLN: STATION SPECTROGRAMS WWLLN: World Wide Lightning Location Network These wideband VLF spectrograms from our lightning sensors show radio atmospherics ('sferics') generated by lightning (vertical lines) and narrowband signals from VLF transmitters (horizontal lines). PRELIMINARY STUDY ON FEATURES OF LIGHTNING DISCHARGE 98 SOLA, 2014, ol. 10, 98−102, doi:10.211sola.2014-020 Abstract Features of lightning around Japan over a four-year period are described using World Wide Lightning Location Network data based on global observations of very low frequency radio waves. HIGHLIGHTS OF A NEW GROUND-BASED, HOURLY GLOBAL … The ground-based World Wide Lightning Location Network (WWLLN) provides unprecedented sampling of lightning frequency, providing a basis for climatologies RELATIVE DETECTION EFFICIENCY OF THE WORLD WIDE LIGHTNING Relative detection efficiency of the World Wide Lightning Location Network M. L. Hutchins,1 R. H. Holzworth,1 J. B. Brundell,2 and C. J. Rodger3 Received 18 May 2012; revised 18 October 2012; accepted 25 October 2012; published 13 December 2012. AN EVALUATION OF THE WORLDWIDE LIGHTNING LOCATION NETWORK An evaluation of the Worldwide Lightning Location Network (WWLLN) using the National Lightning Detection Network (NLDN) as ground truth Sergio F. Abarca,1 Kristen L. Corbosiero,1 and Thomas J. Galarneau Jr.2 Received 19 October 2009; revised 24 May 2010; accepted 2 June 2010; published 22 September 2010. WWLLN - THE WORLD WIDE LIGHTNING LOCATION NETWORKLIGHTNING CLIMATOLOGYGLOBAL MONITORPEER REVIEWED PUBLICATIONSWWLLN.NET/STORMS The WWLLN Management Team, lead by Prof Robert Holzworth of the University of Washington produced these data and images with the cooperation of the universities and institutes which host the stations as listed below. Wideband VLF spectrograms from all WWLLN stations are available this link or by clicking on the station name below. We currently have over 70 sensors around the globe to detect TOGA NETWORK GLOBAL LIGHTNING MAPS Lightning activity for Earth Lightning stroke positions are shown as coloured dots which "cool down" from blue for the most recent (occurring within the last 10 min) through green and yellow to red for the oldest (30-40 minutes earlier). Red asterisks in white circles are active WWLL lightning sensor locations.STORM SELECT PAGE
Tropical Cyclones Data for 1152 storms from Nov. 13, 2009 to Dec. 2,2020
HAROLD - WWLLN
Harold March 31, 2020 to April 11, 2020 Duration: 1 week, 4 days Number of Track Records: 43 WWLLN LIGHTNING CLIMATOLOGY ANIMATIONS GLOBAL and REGIONAL LIGHTNING CLIMATOLOGY BASED ON WWLLN DATA FROM 2008 TO PRESENT. These movies and plots were prepared by K. S. Virts working in collaboration with M. L. Hutchins, J. M. Wallace and R. H.Holzworth
WWLLN: STATION SPECTROGRAMS WWLLN: World Wide Lightning Location Network These wideband VLF spectrograms from our lightning sensors show radio atmospherics ('sferics') generated by lightning (vertical lines) and narrowband signals from VLF transmitters (horizontal lines). PRELIMINARY STUDY ON FEATURES OF LIGHTNING DISCHARGE 98 SOLA, 2014, ol. 10, 98−102, doi:10.211sola.2014-020 Abstract Features of lightning around Japan over a four-year period are described using World Wide Lightning Location Network data based on global observations of very low frequency radio waves. HIGHLIGHTS OF A NEW GROUND-BASED, HOURLY GLOBAL … The ground-based World Wide Lightning Location Network (WWLLN) provides unprecedented sampling of lightning frequency, providing a basis for climatologies RELATIVE DETECTION EFFICIENCY OF THE WORLD WIDE LIGHTNING Relative detection efficiency of the World Wide Lightning Location Network M. L. Hutchins,1 R. H. Holzworth,1 J. B. Brundell,2 and C. J. Rodger3 Received 18 May 2012; revised 18 October 2012; accepted 25 October 2012; published 13 December 2012. AN EVALUATION OF THE WORLDWIDE LIGHTNING LOCATION NETWORK An evaluation of the Worldwide Lightning Location Network (WWLLN) using the National Lightning Detection Network (NLDN) as ground truth Sergio F. Abarca,1 Kristen L. Corbosiero,1 and Thomas J. Galarneau Jr.2 Received 19 October 2009; revised 24 May 2010; accepted 2 June 2010; published 22 September 2010.WWLLN PUBLICATIONS
WWLLN Publications (These articles each depend on WWLLN data) Note to Authors: Please include this statement in your papers using WWLLN data: "Acknowledgement: The WWLLN: STATION SPECTROGRAMS WWLLN: World Wide Lightning Location Network These wideband VLF spectrograms from our lightning sensors show radio atmospherics ('sferics') generated by lightning (vertical lines) and narrowband signals from VLF transmitters (horizontal lines). WWLLN: VOLCANIC LIGHTNING MONITOR The WWLLN Ash Cloud Monitor is an experimental research project, supported in part by a USGS grant to the University of Washington. The project is divided into two parts: AVO (Alaskan Volcano Observatory) volcanos and all global volcanos .The AVO volcanos are singled out because these volcanos are located outside of the earth tropical resions, where natural lightning is common.STORM GROUP PAGE
Name TC Season Region Storm Number Start Date End Date Duration; Amphan: 20: IO: 1: May 15, 2020: May 21, 2020: 6 days: View: Burevi: 20: IO: 5: Nov. 27, 2020: Dec. 2 AN EVALUATION OF THE WORLDWIDE LIGHTNING LOCATION NETWORK An evaluation of the Worldwide Lightning Location Network (WWLLN) using the National Lightning Detection Network (NLDN) as ground truth Sergio F. Abarca,1 Kristen L. Corbosiero,1 and Thomas J. Galarneau Jr.2 Received 19 October 2009; revised 24 May 2010; accepted 2 June 2010; published 22 September 2010. RELATIVE DETECTION EFFICIENCY OF THE WORLD WIDE LIGHTNING Relative detection efficiency of the World Wide Lightning Location Network M. L. Hutchins,1 R. H. Holzworth,1 J. B. Brundell,2 and C. J. Rodger3 Received 18 May 2012; revised 18 October 2012; accepted 25 October 2012; published 13 December 2012. PRELIMINARY STUDY ON FEATURES OF LIGHTNING DISCHARGE 98 SOLA, 2014, ol. 10, 98−102, doi:10.211sola.2014-020 Abstract Features of lightning around Japan over a four-year period are described using World Wide Lightning Location Network data based on global observations of very low frequency radio waves. UNDERSTANDING THE RELATIONSHIPS BETWEEN LIGHTNING, CLOUD Understanding the Relationships between Lightning, Cloud Microphysics, and Airborne Radar-Derived Storm Structure during Hurricane Karl (2010) BRAD REINHART,* HENRY FUELBERG,* RICHARD BLAKESLEE,1 DOUGLAS MACH,# ANDREW HEYMSFIELD,@ AARON BANSEMER,@ STEPHEN L. DURDEN,& SIMONE TANELLI,& GERALD HEYMSFIELD,** AND BJORN LAMBRIGTSEN& * The Florida WWLL GLOBAL LIGHTNING DETECTION SYSTEM: REGIONAL WWLL global lightning detection system: Regional validation study in Brazil Erin H. Lay,1,2 Robert H. Holzworth,1 Craig J. Rodger,3 Jeremy N. Thomas,1 Osmar Pinto Jr.,4 and Richard L. Dowden5 Received 20 October 2003; revised 2 December 2003; accepted 17 December 2003; published 3 February 2004. VLF LIGHTNING LOCATION BY TIME OF GROUP ARRIVAL (TOGA) AT R.L. Dowden et al./Journal of Atmospheric and Solar-Terrestrial Physics 64 (2002) 817–830 819 110 120 130 140 150 160 170 50 45 4035 30 25 20 15 10 5
WWLLN - The World Wide Lightning Location NetworkWWLLN
World Wide Lightning Location Network (wwlln.net)SYSTEM MESSAGE:
NOTE that during this COVID-19 pandemic, the WWLLN network isoperating normally.
All central computers are operational at both the primary and backupsites.
IT support for the network are deemed critical employees of the University of Washington and are thus available in case physical presence is needed on campus. NEW! PUBLIC ACCESS to TROPICAL CYCLONE MONITORING: wwlln.net/storms/OTHER USEFUL LINKS
WWLLN Lightning Visualization will terminate in December 2019 WWLLN backup webserver http://dudwlln.otago.ac.nz/ Global Lightning Climatology with amazing movies!. Volcano global monitor Explosive Ash Cloud Monitor, updated every minute. [See great interview with Dr. Van Eaton (USGS) about ash cloudlightning.
https://physics.aps.org/articles/v13/44 and most importantly: WWLLN Publications: peer reviewed publications. Google Earth overlay for 1 hour of global data ending 6 hours ago isfound HERE .
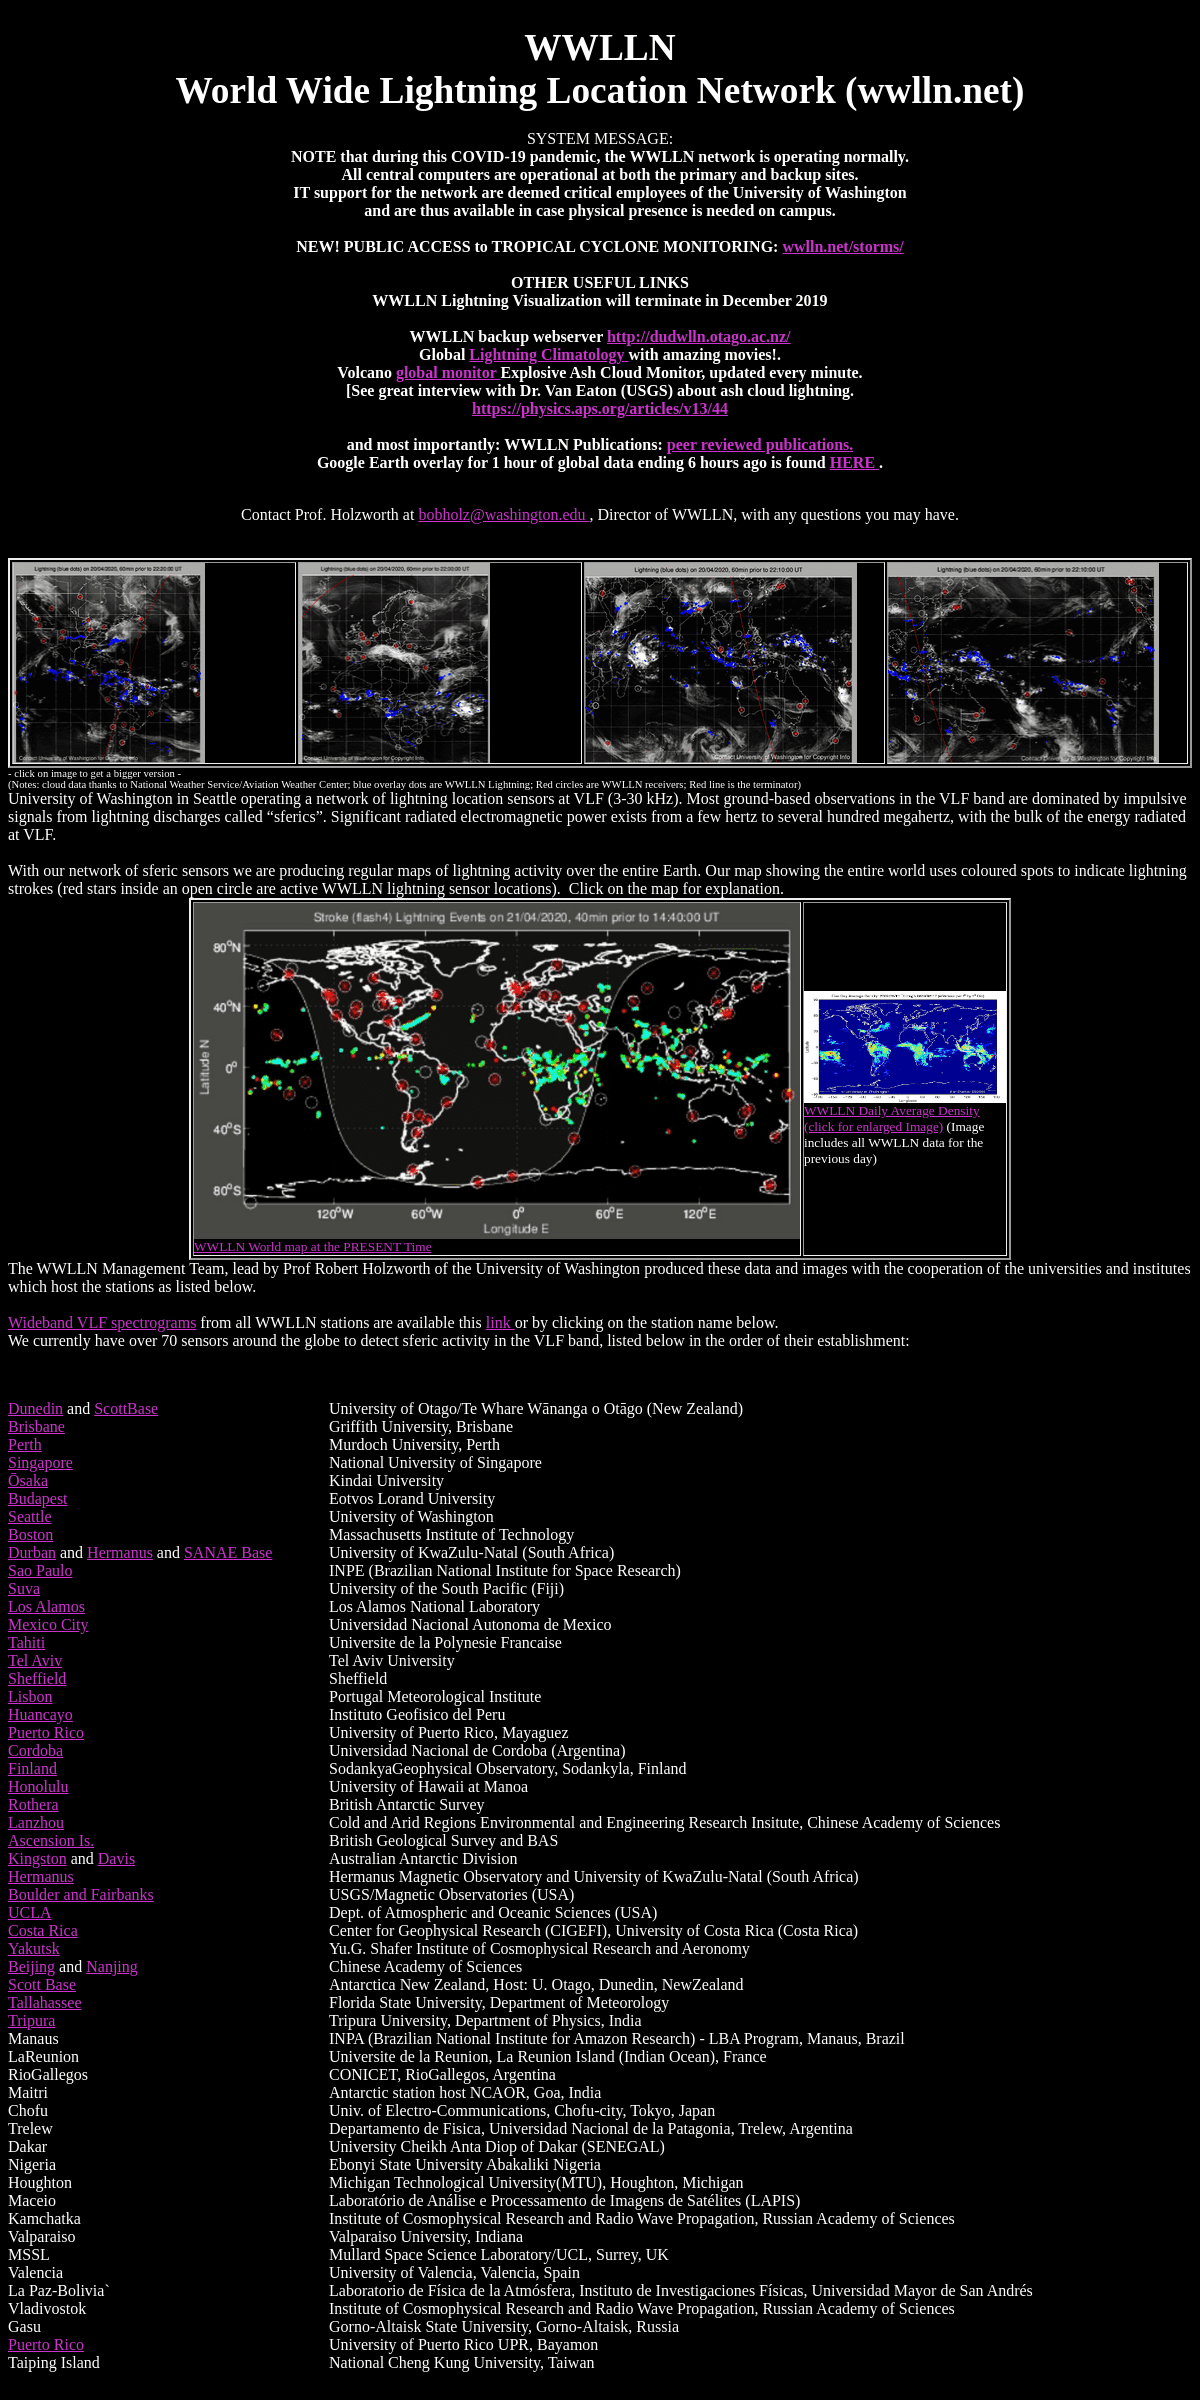
Contact Prof. Holzworth at bobholz@washington.edu , Director of WWLLN, with any questions you may have. - click on image to get a bigger version - (Notes: cloud data thanks to National Weather Service/Aviation Weather Center; blue overlay dots are WWLLN Lightning; Red circles are WWLLN receivers; Red line is the terminator) University of Washington in Seattle operating a network of lightning location sensors at VLF (3-30 kHz). Most ground-based observations in the VLF band are dominated by impulsive signals from lightning discharges called “sferics”. Significant radiated electromagnetic power exists from a few hertz to several hundred megahertz, with the bulk of the energy radiated at VLF. With our network of sferic sensors we are producing regular maps of lightning activity over the entire Earth. Our map showing the entire world uses coloured spots to indicate lightning strokes (red stars inside an open circle are active WWLLN lightning sensor locations). Click on the map for explanation. WWLLN World map at the PRESENT Time WWLLN Daily Average Density (click for enlarged Image) (Image includes all WWLLN data for theprevious day)
The WWLLN Management Team, lead by Prof Robert Holzworth of the University of Washington produced these data and images with the cooperation of the universities and institutes which host the stationsas listed below.
Wideband VLF spectrograms from all WWLLN stations are available this link or by clicking on the station namebelow.
We currently have over 70 sensors around the globe to detect sferic activity in the VLF band, listed below in the order of theirestablishment:
style='color:white'> Dunedin and ScottBase University of Otago/Te Whare Wānanga o Otāgo (New Zealand)Brisbane
Griffith University, BrisbanePerth
Murdoch University, PerthSingapore
National University of SingaporeŌsaka
Kindai University
Budapest
Eotvos Lorand UniversitySeattle
University of WashingtonBoston
Massachusetts Institute of TechnologyDurban
and Hermanus and SANAE Base University of KwaZulu-Natal (South Africa)Sao Paulo
INPE (Brazilian National Institute for Space Research)Suva
University of the South Pacific (Fiji)Los Alamos
Los Alamos National LaboratoryMexico City
Universidad Nacional Autonoma de MexicoTahiti
Universite de la Polynesie FrancaiseTel Aviv
Tel Aviv University
Sheffield
Sheffield
Lisbon
Portugal Meteorological InstituteHuancayo
Instituto Geofisico del PeruPuerto Rico
University of Puerto Rico, MayaguezCordoba
Universidad Nacional de Cordoba (Argentina)Finland
SodankyaGeophysical Observatory, Sodankyla, FinlandHonolulu
University of Hawaii at ManoaRothera
British Antarctic SurveyLanzhou
Cold and Arid Regions Environmental and Engineering Research Insitute, Chinese Academy of SciencesAscension Is.
British Geological Survey and BASKingston and
Davis
Australian Antarctic DivisionHermanus
Hermanus Magnetic Observatory and University of KwaZulu-Natal (SouthAfrica)
Boulder and Fairbanks USGS/Magnetic Observatories (USA)UCLA
Dept. of Atmospheric and Oceanic Sciences (USA)Costa Rica
Center for Geophysical Research (CIGEFI), University of Costa Rica(Costa Rica)
Yakutsk
Yu.G. Shafer Institute of Cosmophysical Research and Aeronomy Beijing and Nanjing Chinese Academy of SciencesScott Base
Antarctica New Zealand, Host: U. Otago, Dunedin, NewZealandTallahassee
Florida State University, Department of MeteorologyTripura
Tripura University, Department of Physics, IndiaManaus
INPA (Brazilian National Institute for Amazon Research) - LBA Program,Manaus, Brazil
LaReunion
Universite de la Reunion, La Reunion Island (Indian Ocean), FranceRioGallegos
CONICET, RioGallegos, ArgentinaMaitri
Antarctic station host NCAOR, Goa, IndiaChofu
Univ. of Electro-Communications, Chofu-city, Tokyo, JapanTrelew
Departamento de Fisica, Universidad Nacional de la Patagonia, Trelew,Argentina
Dakar
University Cheikh Anta Diop of Dakar (SENEGAL)Nigeria
Ebonyi State University Abakaliki NigeriaHoughton
Michigan Technological University(MTU), Houghton, MichiganMaceio
Laboratório de Análise e Processamento de Imagens de Satélites(LAPIS)
Kamchatka
Institute of Cosmophysical Research and Radio Wave Propagation, Russian Academy of SciencesValparaiso
Valparaiso University, IndianaMSSL
Mullard Space Science Laboratory/UCL, Surrey, UKValencia
University of Valencia, Valencia, SpainLa Paz-Bolivia`
Laboratorio de Física de la Atmósfera, Instituto de Investigaciones Físicas, Universidad Mayor de San AndrésVladivostok
Institute of Cosmophysical Research and Radio Wave Propagation, Russian Academy of SciencesGasu
Gorno-Altaisk State University, Gorno-Altaisk, RussiaPuerto Rico
University of Puerto Rico UPR, BayamonTaiping Island
National Cheng Kung University, Taiwan http://163.178.48.4/vlf.png http://163.178.48.4/vlf.png http://163.178.48.4/vlf.png http://163.178.48.4/vlf.pngHow it works
We welcome offers of hosting a new WWLLN sensor to add to the list above. All hosts receive all the world-wide data for their own research on monthly CDs. In return, each host provides the computer and meets any local expenses like power, Internet, and maintenance. However, do not think that a sensor on your own campus is going to give you lightning location data on its own. Only the whole networkdoes that.
Each lightning stroke location requires the time of group arrival (TOGA) from a least 5 WWLLN sensors. These sensors may be several thousand km distant from the stroke. The geographical arrangement of the sensors is important: a lightning stroke which is enclosed by sensors is much more accurately located than one which is not so enclosed. Clearly a uniform spacing of sensors around the Earth is the ideal. Since the Earth is round, there are no edges: every lightning stroke is surrounded by sensors, but not necessarily by the sensors which sense it. Typically only about 15 to 30% of strokes detected by one sensor are detected by 5 or more. These strokes are usually the stronger ones. Recent research indicates our detection efficiency for strokes about 30 kA is approximately 30% globally. To cover the whole world by sensors spaced uniformly about 1000 km apart would require roughly 500 sensors. If spaced 3000 km apart, we would need “only” around 50 to 60 sensors. Presently we have 40 WWLLN sensors, and we are in the process of expanding to 60 sensors within the next year or two.More information
More information on the World Wide Lightning Location network (WWLLN) is available from our publication list:
WWLLN Data available WWLLN MONTHLY CDS containing all stroke locations over the whole world for 1 month. These are mailed to subscribers each month, or they may opt to download the data weekly. Archival data are available for sale from August 15, 2004 to the present. Our site hosts receive a free monthly subscription. WWLLN DATA ARE AVAILABLE VIA INTERNET with cadence every 10 minutes for research purposes from the University of Washington, or with a cadence of as fast as every minute (i.e. in realtime) from our commercial reseller. Contact Prof. Holzworth for more info.Contact
for all questions relating to WWLLN: Prof Robert Holzworth, Earth and Space Sciences, University ofWashington
bobholz@washington.edu Webpage maintained by: Craig J Rodger (University of Otago) Robert Holzworth (University of Washington) Lightning image thanks to photolib.noaa.govWeb editing:
Bob Holzworth (bobholz@washington.edu)Details
4