1
More Annotations


1


5
Favourite Annotations


5

3
Text
TAPCLICKS: THE SMART MARKETING CLOUDUKSUPPORTPARTNERSMEDIA COMPANIESMARKETPLACETHE TRADE DESK Trusted by Agencies, Media Companies, Consumer Brands and Partners. “They helped streamline and automate the process, saving us enough in man-hours alone to achieve our ROI goals. Most importantly, we now have a tool that helps us attract new clients as well as up-sell and better retain our existing clients.”. “TapClicks has allowed us to TAPCLICKS ANALYTICS & REPORTING PACKAGES Starting At. $1,799 / mo. Elite Feature Set. 250+ Data Connectors. Dedicated Support. Elite is the most complete and powerful marketing, reporting and analytics solution in the world. In addition to all Pro Plan features, Elite includes advanced calculations, cross channel comparisons, report builder, hierarchical data management, data TWITTER
sharing
CONTACT US - TAPCLICKS 3031 Tisch WaySuite #900San Jose, CA 95128Tel: +1 (408) 725-2942 MEDIA PLANNING TOOLS: AN IN DEPTH ANALYSIS OF MEDIAOCEAN Tools like MediaOcean are an industry favorite for media planning and execution. As you develop complex marketing plans, these platforms save you time and ensure your clients easily understand and accept your proposals. Most of the existing roundups of media planning software are basic lists, product pages, or review sites. DATORAMA ALTERNATIVES: COMPARING THE TOP 4 MARKETING In this article, we looked at 4 of the top marketing analytics platforms: TapClicks, Datorama, Tableau, and Domo. As discussed, if you’re looking for a platform that can manage data across every department in your company, and you have a slightly larger budget, then Tableau or Domo may be a good fit for you.TAPCLICKS
Getting Started. These Quick Start Guides and Onboarding Resources will help your team get up to speed fast. SHOULD YOU BUILD YOUR OWN ENTERPRISE REPORTING SYSTEM Often agencies or media companies who come to us to discuss buying TapClicks as a reporting software say that they’re also consideringbuilding their own
WHAT IS CORRELATION & HOW IS IT USED IN MARKETING What Is Correlation? Correlation is when there is a mutual relationship or connection between two or more things. In mathematical terms, correlation most often applies to the measurement of the relationship between two variables, X and Y. THE ULTIMATE GUIDE TO DATA VISUALIZATION: CHARTS, GRAPHS A few of the most common network data visualization types are alluvial diagram charts, node-link diagrams, network diagram charts, word cloud plots, non-ribbon chord diagram plots, parallel coordinates plot, and matrix charts. If you want to show relationships between data sets, these are the visualizations that you should lean on. HOW TO EFFECTIVELY EMAIL A CEO OR BUSINESS OWNER IN 5 EASY Run your email through spell check and/or use a tool like Grammarly. When in doubt, or for good measure, ask one of your colleagues to give your email a quick read-through before pressing send. 4. Provide context for your question. If you are emailing the business owner or CEO because you have some sort of issue that needs to be resolved,then
TAPCLICKS: THE SMART MARKETING CLOUDUKSUPPORTPARTNERSMEDIA COMPANIESMARKETPLACETHE TRADE DESK Trusted by Agencies, Media Companies, Consumer Brands and Partners. “They helped streamline and automate the process, saving us enough in man-hours alone to achieve our ROI goals. Most importantly, we now have a tool that helps us attract new clients as well as up-sell and better retain our existing clients.”. “TapClicks has allowed us to TAPCLICKS ANALYTICS & REPORTING PACKAGES Starting At. $1,799 / mo. Elite Feature Set. 250+ Data Connectors. Dedicated Support. Elite is the most complete and powerful marketing, reporting and analytics solution in the world. In addition to all Pro Plan features, Elite includes advanced calculations, cross channel comparisons, report builder, hierarchical data management, datasharing
CONTACT US - TAPCLICKS 3031 Tisch WaySuite #900San Jose, CA 95128Tel: +1 (408) 725-2942 MEDIA PLANNING TOOLS: AN IN DEPTH ANALYSIS OF MEDIAOCEAN Tools like MediaOcean are an industry favorite for media planning and execution. As you develop complex marketing plans, these platforms save you time and ensure your clients easily understand and accept your proposals. Most of the existing roundups of media planning software are basic lists, product pages, or review sites. DATORAMA ALTERNATIVES: COMPARING THE TOP 4 MARKETING In this article, we looked at 4 of the top marketing analytics platforms: TapClicks, Datorama, Tableau, and Domo. As discussed, if you’re looking for a platform that can manage data across every department in your company, and you have a slightly larger budget, then Tableau or Domo may be a good fit for you.TAPCLICKS
Getting Started. These Quick Start Guides and Onboarding Resources will help your team get up to speed fast. SHOULD YOU BUILD YOUR OWN ENTERPRISE REPORTING SYSTEM Often agencies or media companies who come to us to discuss buying TapClicks as a reporting software say that they’re also consideringbuilding their own
WHAT IS CORRELATION & HOW IS IT USED IN MARKETING What Is Correlation? Correlation is when there is a mutual relationship or connection between two or more things. In mathematical terms, correlation most often applies to the measurement of the relationship between two variables, X and Y. THE ULTIMATE GUIDE TO DATA VISUALIZATION: CHARTS, GRAPHS A few of the most common network data visualization types are alluvial diagram charts, node-link diagrams, network diagram charts, word cloud plots, non-ribbon chord diagram plots, parallel coordinates plot, and matrix charts. If you want to show relationships between data sets, these are the visualizations that you should lean on. HOW TO EFFECTIVELY EMAIL A CEO OR BUSINESS OWNER IN 5 EASY Run your email through spell check and/or use a tool like Grammarly. When in doubt, or for good measure, ask one of your colleagues to give your email a quick read-through before pressing send. 4. Provide context for your question. If you are emailing the business owner or CEO because you have some sort of issue that needs to be resolved,then
TAPCLICKS ANALYTICS & REPORTING PACKAGES Starting At. $1,799 / mo. Elite Feature Set. 250+ Data Connectors. Dedicated Support. Elite is the most complete and powerful marketing, reporting and analytics solution in the world. In addition to all Pro Plan features, Elite includes advanced calculations, cross channel comparisons, report builder, hierarchical data management, datasharing
RESOURCES - TAPCLICKS What's On Tap Blog Thought Leadership Press Releases Case Studies Thought Leadership TapClicks Q4-2020 Martech Benchmark Report Read More TapClicks Q3-2020RAVEN BY TAPCLICKS
Detect, prioritize, and resolve technical SEO issues at the speed of search. Automate your regular SEO audits to uncover and eliminate site errors with an easy-to-follow checklist to prevent on-page SEO issues from interfering with user experience. Automated Scheduling. GOOGLE ADS REPORTING TOOL: 4 KEY FEATURES FOR AGENCIES Agencies (no matter their size) often rely on inefficient tools and processes to handle their Google Ads reporting. For example, it’s not uncommon for marketers to rely solely on Excel spreadsheets and PowerPoint to create and distribute PPC reports to their clients. FIND OUT HOW MUCH YOU CAN SAVE BY AUTOMATING YOUR CAMPAIGN Doing more with less is a constant sentiment from marketing operations. How do you measure your effectiveness or cost savings? TapClicks’ Orders and Workflow does just that and our calculator will tell you how much you’ll save. Try it out today! THE ULTIMATE GUIDE TO DATA VISUALIZATION: CHARTS, GRAPHS A few of the most common network data visualization types are alluvial diagram charts, node-link diagrams, network diagram charts, word cloud plots, non-ribbon chord diagram plots, parallel coordinates plot, and matrix charts. If you want to show relationships between data sets, these are the visualizations that you should lean on. 30+ BEST MARKETING ANALYTICS AND REPORTING SOFTWARE As the number of marketing analytics and reporting software on the market continues to grow, figuring out which tool is right for your business is requiring more and more time to research and weigh optionsagainst each other.
CENTRO BASIS DSP
Locate the Centro Basis DSP Data Source. 1] Login to TapClicks and on the Data menu, click Data Sources. 2] The menu of data sources appears. 3] To locate the Centro Basis DSP data source, either scroll through the list of data sources or enter the data source into the search box in the upper right (results appear automatically). HOW TO CRAFT EMAILS FOR YOUR CREATIVE TEAM (OR FOR ANY OF Write a clear subject line. This is the most obvious piece of advice out there, yet, the majority of people fail to realize that they’ve titled their emails poorly. Your subject line should immediately convey the purpose of your email. Whether it’s a particular call to action, a request for updates, or informing your team about a meeting 6 STEPS TO CREATING A BETTER MARKETING DASHBOARD: (2018 A marketing dashboard is a compilation of all of the pertinent data about a company’s marketing efforts. Marketing dashboards benefit both marketing and the executive team. They can give an at-a-glance view that quantifies the overall impact marketing has on the business and how marketing initiatives increase customer acquisition, retention, and sales. TAPCLICKS: THE SMART MARKETING CLOUDUKSUPPORTPARTNERSMEDIA COMPANIESMARKETPLACETHE TRADE DESK Trusted by Agencies, Media Companies, Consumer Brands and Partners. “They helped streamline and automate the process, saving us enough in man-hours alone to achieve our ROI goals. Most importantly, we now have a tool that helps us attract new clients as well as up-sell and better retain our existing clients.”. “TapClicks has allowed us to TAPCLICKS ANALYTICS & REPORTING PACKAGES Starting At. $1,799 / mo. Elite Feature Set. 250+ Data Connectors. Dedicated Support. Elite is the most complete and powerful marketing, reporting and analytics solution in the world. In addition to all Pro Plan features, Elite includes advanced calculations, cross channel comparisons, report builder, hierarchical data management, datasharing
CONTACT US - TAPCLICKS 3031 Tisch WaySuite #900San Jose, CA 95128Tel: +1 (408) 725-2942TAPCLICKS
Getting Started. These Quick Start Guides and Onboarding Resources will help your team get up to speed fast. MEDIA PLANNING TOOLS: AN IN DEPTH ANALYSIS OF MEDIAOCEAN Tools like MediaOcean are an industry favorite for media planning and execution. As you develop complex marketing plans, these platforms save you time and ensure your clients easily understand and accept your proposals. Most of the existing roundups of media planning software are basic lists, product pages, or review sites. WHAT IS CORRELATION & HOW IS IT USED IN MARKETING What Is Correlation? Correlation is when there is a mutual relationship or connection between two or more things. In mathematical terms, correlation most often applies to the measurement of the relationship between two variables, X and Y. DATORAMA ALTERNATIVES: COMPARING THE TOP 4 MARKETING In this article, we looked at 4 of the top marketing analytics platforms: TapClicks, Datorama, Tableau, and Domo. As discussed, if you’re looking for a platform that can manage data across every department in your company, and you have a slightly larger budget, then Tableau or Domo may be a good fit for you. THE ULTIMATE GUIDE TO DATA VISUALIZATION: CHARTS, GRAPHS A few of the most common network data visualization types are alluvial diagram charts, node-link diagrams, network diagram charts, word cloud plots, non-ribbon chord diagram plots, parallel coordinates plot, and matrix charts. If you want to show relationships between data sets, these are the visualizations that you should lean on. SHOULD YOU BUILD YOUR OWN ENTERPRISE REPORTING SYSTEM Often agencies or media companies who come to us to discuss buying TapClicks as a reporting software say that they’re also consideringbuilding their own
HOW TO EFFECTIVELY EMAIL A CEO OR BUSINESS OWNER IN 5 EASY Run your email through spell check and/or use a tool like Grammarly. When in doubt, or for good measure, ask one of your colleagues to give your email a quick read-through before pressing send. 4. Provide context for your question. If you are emailing the business owner or CEO because you have some sort of issue that needs to be resolved,then
TAPCLICKS: THE SMART MARKETING CLOUDUKSUPPORTPARTNERSMEDIA COMPANIESMARKETPLACETHE TRADE DESK Trusted by Agencies, Media Companies, Consumer Brands and Partners. “They helped streamline and automate the process, saving us enough in man-hours alone to achieve our ROI goals. Most importantly, we now have a tool that helps us attract new clients as well as up-sell and better retain our existing clients.”. “TapClicks has allowed us to TAPCLICKS ANALYTICS & REPORTING PACKAGES Starting At. $1,799 / mo. Elite Feature Set. 250+ Data Connectors. Dedicated Support. Elite is the most complete and powerful marketing, reporting and analytics solution in the world. In addition to all Pro Plan features, Elite includes advanced calculations, cross channel comparisons, report builder, hierarchical data management, datasharing
CONTACT US - TAPCLICKS 3031 Tisch WaySuite #900San Jose, CA 95128Tel: +1 (408) 725-2942TAPCLICKS
Getting Started. These Quick Start Guides and Onboarding Resources will help your team get up to speed fast. MEDIA PLANNING TOOLS: AN IN DEPTH ANALYSIS OF MEDIAOCEAN Tools like MediaOcean are an industry favorite for media planning and execution. As you develop complex marketing plans, these platforms save you time and ensure your clients easily understand and accept your proposals. Most of the existing roundups of media planning software are basic lists, product pages, or review sites. WHAT IS CORRELATION & HOW IS IT USED IN MARKETING What Is Correlation? Correlation is when there is a mutual relationship or connection between two or more things. In mathematical terms, correlation most often applies to the measurement of the relationship between two variables, X and Y. DATORAMA ALTERNATIVES: COMPARING THE TOP 4 MARKETING In this article, we looked at 4 of the top marketing analytics platforms: TapClicks, Datorama, Tableau, and Domo. As discussed, if you’re looking for a platform that can manage data across every department in your company, and you have a slightly larger budget, then Tableau or Domo may be a good fit for you. THE ULTIMATE GUIDE TO DATA VISUALIZATION: CHARTS, GRAPHS A few of the most common network data visualization types are alluvial diagram charts, node-link diagrams, network diagram charts, word cloud plots, non-ribbon chord diagram plots, parallel coordinates plot, and matrix charts. If you want to show relationships between data sets, these are the visualizations that you should lean on. SHOULD YOU BUILD YOUR OWN ENTERPRISE REPORTING SYSTEM Often agencies or media companies who come to us to discuss buying TapClicks as a reporting software say that they’re also consideringbuilding their own
HOW TO EFFECTIVELY EMAIL A CEO OR BUSINESS OWNER IN 5 EASY Run your email through spell check and/or use a tool like Grammarly. When in doubt, or for good measure, ask one of your colleagues to give your email a quick read-through before pressing send. 4. Provide context for your question. If you are emailing the business owner or CEO because you have some sort of issue that needs to be resolved,then
TAPCLICKS ANALYTICS & REPORTING PACKAGES Starting At. $1,799 / mo. Elite Feature Set. 250+ Data Connectors. Dedicated Support. Elite is the most complete and powerful marketing, reporting and analytics solution in the world. In addition to all Pro Plan features, Elite includes advanced calculations, cross channel comparisons, report builder, hierarchical data management, datasharing
RESOURCES - TAPCLICKS What's On Tap Blog Thought Leadership Press Releases Case Studies Thought Leadership TapClicks Q4-2020 Martech Benchmark Report Read More TapClicks Q3-2020RAVEN BY TAPCLICKS
Detect, prioritize, and resolve technical SEO issues at the speed of search. Automate your regular SEO audits to uncover and eliminate site errors with an easy-to-follow checklist to prevent on-page SEO issues from interfering with user experience. Automated Scheduling. FIND OUT HOW MUCH YOU CAN SAVE BY AUTOMATING YOUR CAMPAIGN Doing more with less is a constant sentiment from marketing operations. How do you measure your effectiveness or cost savings? TapClicks’ Orders and Workflow does just that and our calculator will tell you how much you’ll save. Try it out today! THE ULTIMATE GUIDE TO DATA VISUALIZATION: CHARTS, GRAPHS A few of the most common network data visualization types are alluvial diagram charts, node-link diagrams, network diagram charts, word cloud plots, non-ribbon chord diagram plots, parallel coordinates plot, and matrix charts. If you want to show relationships between data sets, these are the visualizations that you should lean on. STACKADAPT - SUPPORT GUIDE Before you begin: The StackAdapt data source provides data already organized for your use in TapClicks reporting.. Instructions:. Locate the StackAdapt Data Source. 1] Login to TapClicks and on the Data menu, click Data Sources.. 2] The menu of data sources appears. SHOPIFY - SUPPORT GUIDE Before you begin: The Shopify data source provides data already organized for your use in TapClicks reporting.. Instructions:. Locate the Shopify Data Source. 1] Login to TapClicks and on the Data menu, click Data Sources.. 2] The menu of data sources appears. THE 12 BEST DATA VISUALIZATIONS TO INSPIRE MARKETING TEAMS 12. Arctic Sea Ice Extent. Climate change is a real problem with real data backing it up. Data visualization engineer Adam Crahen produced a simple but beautiful interactive infographic to show some of this data in an easily understood way, illustrating the decline of the Arctic Sea Ice extent from 1989 to 2017. SHOULD YOU BUILD YOUR OWN ENTERPRISE REPORTING SYSTEM Marketing Operations Platform . Take command of your data . tapAnalytics . Analyze performance . tapReports . Communicate & collaborate . tapWorkflow . Automate your workflow 6 STEPS TO CREATING A BETTER MARKETING DASHBOARD: (2018 A marketing dashboard is a compilation of all of the pertinent data about a company’s marketing efforts. Marketing dashboards benefit both marketing and the executive team. They can give an at-a-glance view that quantifies the overall impact marketing has on the business and how marketing initiatives increase customer acquisition, retention, and sales. TAPCLICKS: THE SMART MARKETING CLOUDUKSUPPORTPARTNERSMEDIA COMPANIESMARKETPLACETHE TRADE DESK Trusted by Agencies, Media Companies, Consumer Brands and Partners. “They helped streamline and automate the process, saving us enough in man-hours alone to achieve our ROI goals. Most importantly, we now have a tool that helps us attract new clients as well as up-sell and better retain our existing clients.”. “TapClicks has allowed us to TAPCLICKS ANALYTICS & REPORTING PACKAGES Starting At. $1,799 / mo. Elite Feature Set. 250+ Data Connectors. Dedicated Support. Elite is the most complete and powerful marketing, reporting and analytics solution in the world. In addition to all Pro Plan features, Elite includes advanced calculations, cross channel comparisons, report builder, hierarchical data management, datasharing
CONTACT US - TAPCLICKS 3031 Tisch WaySuite #900San Jose, CA 95128Tel: +1 (408) 725-2942TAPCLICKS
Getting Started. These Quick Start Guides and Onboarding Resources will help your team get up to speed fast. MEDIA PLANNING TOOLS: AN IN DEPTH ANALYSIS OF MEDIAOCEAN Tools like MediaOcean are an industry favorite for media planning and execution. As you develop complex marketing plans, these platforms save you time and ensure your clients easily understand and accept your proposals. Most of the existing roundups of media planning software are basic lists, product pages, or review sites. WHAT IS CORRELATION & HOW IS IT USED IN MARKETING What Is Correlation? Correlation is when there is a mutual relationship or connection between two or more things. In mathematical terms, correlation most often applies to the measurement of the relationship between two variables, X and Y. DATORAMA ALTERNATIVES: COMPARING THE TOP 4 MARKETING In this article, we looked at 4 of the top marketing analytics platforms: TapClicks, Datorama, Tableau, and Domo. As discussed, if you’re looking for a platform that can manage data across every department in your company, and you have a slightly larger budget, then Tableau or Domo may be a good fit for you. THE ULTIMATE GUIDE TO DATA VISUALIZATION: CHARTS, GRAPHS A few of the most common network data visualization types are alluvial diagram charts, node-link diagrams, network diagram charts, word cloud plots, non-ribbon chord diagram plots, parallel coordinates plot, and matrix charts. If you want to show relationships between data sets, these are the visualizations that you should lean on. SHOULD YOU BUILD YOUR OWN ENTERPRISE REPORTING SYSTEM Often agencies or media companies who come to us to discuss buying TapClicks as a reporting software say that they’re also consideringbuilding their own
HOW TO EFFECTIVELY EMAIL A CEO OR BUSINESS OWNER IN 5 EASY Run your email through spell check and/or use a tool like Grammarly. When in doubt, or for good measure, ask one of your colleagues to give your email a quick read-through before pressing send. 4. Provide context for your question. If you are emailing the business owner or CEO because you have some sort of issue that needs to be resolved,then
TAPCLICKS: THE SMART MARKETING CLOUDUKSUPPORTPARTNERSMEDIA COMPANIESMARKETPLACETHE TRADE DESK Trusted by Agencies, Media Companies, Consumer Brands and Partners. “They helped streamline and automate the process, saving us enough in man-hours alone to achieve our ROI goals. Most importantly, we now have a tool that helps us attract new clients as well as up-sell and better retain our existing clients.”. “TapClicks has allowed us to TAPCLICKS ANALYTICS & REPORTING PACKAGES Starting At. $1,799 / mo. Elite Feature Set. 250+ Data Connectors. Dedicated Support. Elite is the most complete and powerful marketing, reporting and analytics solution in the world. In addition to all Pro Plan features, Elite includes advanced calculations, cross channel comparisons, report builder, hierarchical data management, datasharing
CONTACT US - TAPCLICKS 3031 Tisch WaySuite #900San Jose, CA 95128Tel: +1 (408) 725-2942TAPCLICKS
Getting Started. These Quick Start Guides and Onboarding Resources will help your team get up to speed fast. MEDIA PLANNING TOOLS: AN IN DEPTH ANALYSIS OF MEDIAOCEAN Tools like MediaOcean are an industry favorite for media planning and execution. As you develop complex marketing plans, these platforms save you time and ensure your clients easily understand and accept your proposals. Most of the existing roundups of media planning software are basic lists, product pages, or review sites. WHAT IS CORRELATION & HOW IS IT USED IN MARKETING What Is Correlation? Correlation is when there is a mutual relationship or connection between two or more things. In mathematical terms, correlation most often applies to the measurement of the relationship between two variables, X and Y. DATORAMA ALTERNATIVES: COMPARING THE TOP 4 MARKETING In this article, we looked at 4 of the top marketing analytics platforms: TapClicks, Datorama, Tableau, and Domo. As discussed, if you’re looking for a platform that can manage data across every department in your company, and you have a slightly larger budget, then Tableau or Domo may be a good fit for you. THE ULTIMATE GUIDE TO DATA VISUALIZATION: CHARTS, GRAPHS A few of the most common network data visualization types are alluvial diagram charts, node-link diagrams, network diagram charts, word cloud plots, non-ribbon chord diagram plots, parallel coordinates plot, and matrix charts. If you want to show relationships between data sets, these are the visualizations that you should lean on. SHOULD YOU BUILD YOUR OWN ENTERPRISE REPORTING SYSTEM Often agencies or media companies who come to us to discuss buying TapClicks as a reporting software say that they’re also consideringbuilding their own
HOW TO EFFECTIVELY EMAIL A CEO OR BUSINESS OWNER IN 5 EASY Run your email through spell check and/or use a tool like Grammarly. When in doubt, or for good measure, ask one of your colleagues to give your email a quick read-through before pressing send. 4. Provide context for your question. If you are emailing the business owner or CEO because you have some sort of issue that needs to be resolved,then
TAPCLICKS ANALYTICS & REPORTING PACKAGES Starting At. $1,799 / mo. Elite Feature Set. 250+ Data Connectors. Dedicated Support. Elite is the most complete and powerful marketing, reporting and analytics solution in the world. In addition to all Pro Plan features, Elite includes advanced calculations, cross channel comparisons, report builder, hierarchical data management, datasharing
RESOURCES - TAPCLICKS What's On Tap Blog Thought Leadership Press Releases Case Studies Thought Leadership TapClicks Q4-2020 Martech Benchmark Report Read More TapClicks Q3-2020RAVEN BY TAPCLICKS
Detect, prioritize, and resolve technical SEO issues at the speed of search. Automate your regular SEO audits to uncover and eliminate site errors with an easy-to-follow checklist to prevent on-page SEO issues from interfering with user experience. Automated Scheduling. FIND OUT HOW MUCH YOU CAN SAVE BY AUTOMATING YOUR CAMPAIGN Doing more with less is a constant sentiment from marketing operations. How do you measure your effectiveness or cost savings? TapClicks’ Orders and Workflow does just that and our calculator will tell you how much you’ll save. Try it out today! THE ULTIMATE GUIDE TO DATA VISUALIZATION: CHARTS, GRAPHS A few of the most common network data visualization types are alluvial diagram charts, node-link diagrams, network diagram charts, word cloud plots, non-ribbon chord diagram plots, parallel coordinates plot, and matrix charts. If you want to show relationships between data sets, these are the visualizations that you should lean on. 30+ BEST MARKETING ANALYTICS AND REPORTING SOFTWARE As the number of marketing analytics and reporting software on the market continues to grow, figuring out which tool is right for your business is requiring more and more time to research and weigh optionsagainst each other.
STACKADAPT - SUPPORT GUIDE Before you begin: The StackAdapt data source provides data already organized for your use in TapClicks reporting.. Instructions:. Locate the StackAdapt Data Source. 1] Login to TapClicks and on the Data menu, click Data Sources.. 2] The menu of data sources appears. THE 12 BEST DATA VISUALIZATIONS TO INSPIRE MARKETING TEAMS 12. Arctic Sea Ice Extent. Climate change is a real problem with real data backing it up. Data visualization engineer Adam Crahen produced a simple but beautiful interactive infographic to show some of this data in an easily understood way, illustrating the decline of the Arctic Sea Ice extent from 1989 to 2017. SHOULD YOU BUILD YOUR OWN ENTERPRISE REPORTING SYSTEM Marketing Operations Platform . Take command of your data . tapAnalytics . Analyze performance . tapReports . Communicate & collaborate . tapWorkflow . Automate your workflow 6 STEPS TO CREATING A BETTER MARKETING DASHBOARD: (2018 A marketing dashboard is a compilation of all of the pertinent data about a company’s marketing efforts. Marketing dashboards benefit both marketing and the executive team. They can give an at-a-glance view that quantifies the overall impact marketing has on the business and how marketing initiatives increase customer acquisition, retention, and sales.* Platform
*
*
MARKETING OPERATIONS PLATFORM Take command of your data*
TAPANALYTICS
Analyze performance
*
TAPREPORTS
Communicate & collaborate*
TAPWORKFLOW
Automate your workflow*
TAPORDERS
Automated order entry*
COMPETITIVE INTELLIGENCE Uncover competitor strategy*
RAVEN
All-In-One SEM & SEO Tools*
TAPFUSION FOR GDS
All your advertising data in one place*
Try it free! Get Started* Solutions
*
*
MEDIA COMPANIES
One solution for all your marketing and sales operations*
BRANDS
Attribute in-store sales to digital campaigns*
AGENCIES
Manage your clients' data in one unified platform*
FRANCHISES
A scalable marketing operations platform*
HIPAA FOR HEALTHCARE Keep your business and data protected*
Try it free! Get Started* Marketplace
* Partners
*
*
MARKETPLACE PARTNERS Marketplace Plans, Integrations and More*
REVENUE PARTNERS
Grow revenue and expand customers with TapClicks*
TECHNOLOGY PARTNERS
Expand the TapClicks platform with your technology*
PARTNER REFERRAL SUBMISSION Get $200 Per Qualified Lead*
Try it free! Get Started* Resources
*
*
WHAT'S ON TAP
Press releases, case studies, news, and more*
WEBINARS
Hot Topics on Omnichannel Marketing*
KNOWLEDGE BASE
Find answers and get help with TapClicks*
TAPCLICKS ACADEMY
Online coursework and training designed for you*
FIND MY INSTANCE
Quickly locate your TapClicks or Raven instance*
Try it free! Get Started* Demo
* __
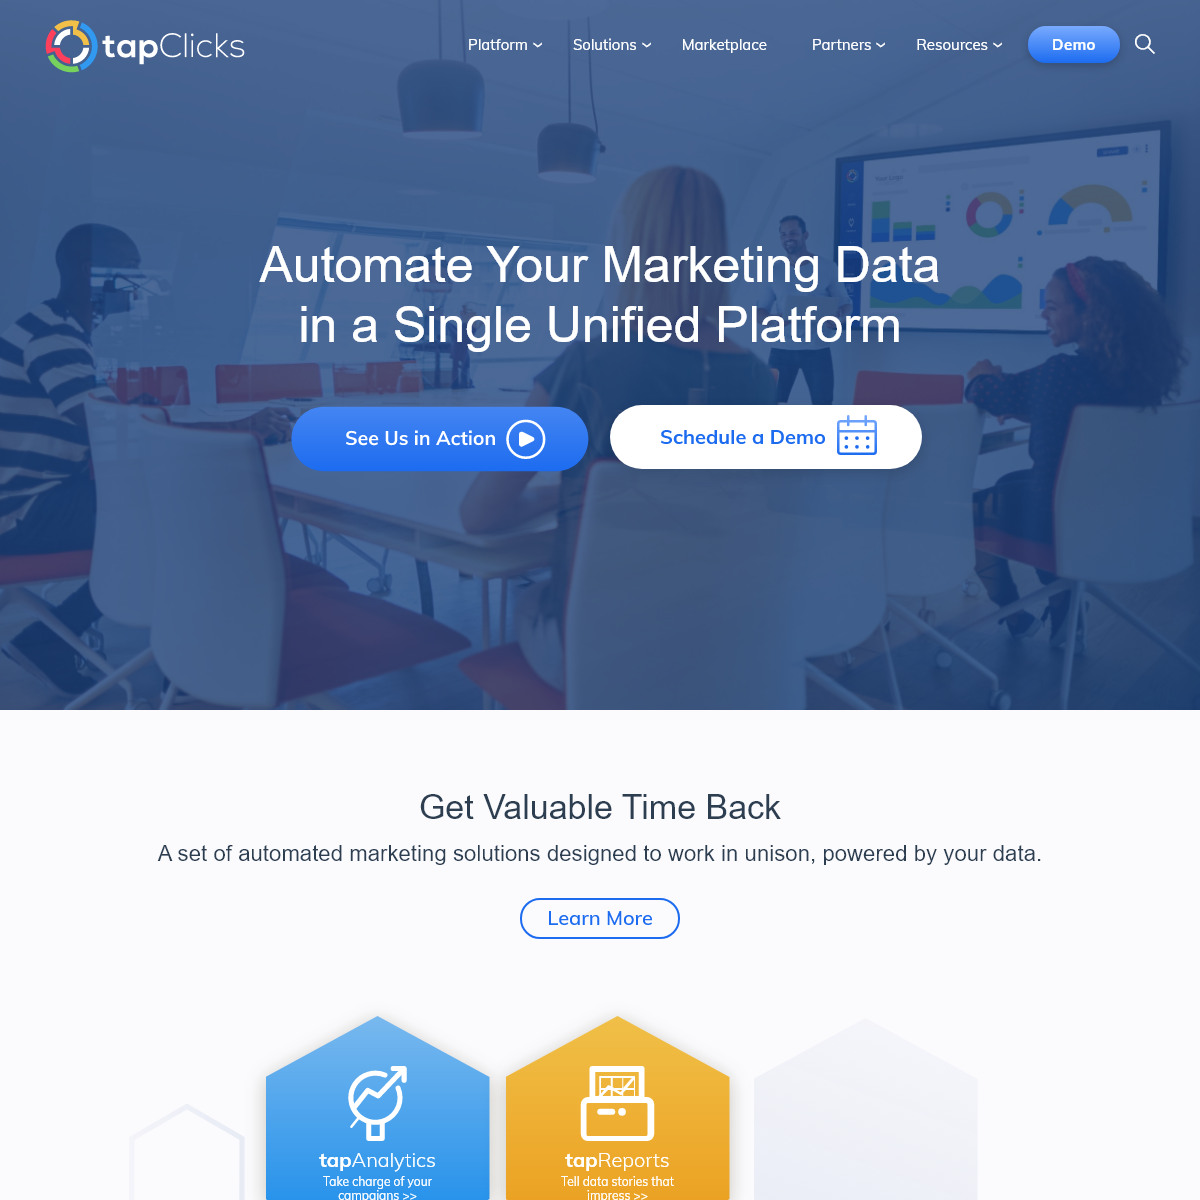
AUTOMATE YOUR MARKETING DATA IN A SINGLE UNIFIED PLATFORMSchedule a Demo
GET VALUABLE TIME BACK A SET OF AUTOMATED MARKETING SOLUTIONS DESIGNED TO WORK IN UNISON, POWERED BY YOUR DATA.Learn More
TAPANALYTICS
Take charge of your campaigns >>TAPREPORTS
Tell data stories that impress >>TAPORDERS
Let your sales team focus on the sale >>TAPWORKFLOW
Ignite your fullfillment process >> COMPETITIVE INTELLIGENCE Uncover your digital marketing blindspots >>RAVEN
All-in-One Organic and Search Marketing Platform >> ENDLESS CUSTOMIZATION WITH ALL YOUR CONNECTORS IN ONE PLACE DISCOVER OUR DEPTH OF INSTANT-ON DATA SOURCES.QUICKBOOKS ONLINE
View Connector
FACEBOOK ADS
View Connector
GOOGLE ADS
View Connector
AMAZON ADS
View Connector
ADOBE
View Connector
View Connector
INSTAGRAM PROFESSIONALView Connector
MICROSOFT ADVERTISINGView Connector
YOUTUBE
View Connector
CHOOZLE ENHANCED
View Connector
GOOGLE SEARCH CONSOLEView Connector
LINKEDIN ADS
View Connector
CENTRO BASIS: DSP
View Connector
YEXT
View Connector
THE TRADE DESK
View Connector
KENSHOO
View Connector
VERIZON MEDIA NATIVEView Connector
SIMPLI.FI
View Connector
‹›
All Connectors
TRUSTED BY AGENCIES, MEDIA COMPANIES, CONSUMER BRANDS AND PARTNERS YOU'RE IN GOOD COMPANY Our implementation of TapClicks has been a game changer for us inmany ways.
Having the ability to offer clients a holistic visualization of their marketing campaign has allowed us to go after larger clients andbigger budgets.”
David RowleySr. Director Customer Success TapAnalytics helps our clients toll up all campaign information in a single customizable dashboard, with on-demand reporting, saving a huge amount of time and effort.”Kevin Layton,CEO
They helped streamline and automate the process, saving us enough in man-hours alone to achieve our ROI goals. Most importantly, we now have a tool that helps us attract new clients as well as up-sell and better retain our existing clients.”Gred Dowd,President
Our implementation of TapClicks has been a game changer for us inmany ways.
Having the ability to offer clients a holistic visualization of their marketing campaign has allowed us to go after larger clients andbigger budgets.”
David RowleySr. Director Customer Success TapAnalytics helps our clients toll up all campaign information in a single customizable dashboard, with on-demand reporting, saving a huge amount of time and effort.”Kevin Layton,CEO
They helped streamline and automate the process, saving us enough in man-hours alone to achieve our ROI goals. Most importantly, we now have a tool that helps us attract new clients as well as up-sell and better retain our existing clients.”Gred Dowd,President
WHAT'S ON TAP
READ THE LATEST INDUSTRY NEWS , CASE STUDIES , THOUGHT LEADERSHIP AND PRESS FROM TAPCLICKS.Blog
Enterprise Reporting Tools: The Feature That’s Non-NegotiableBlog
Advertising Analytics Tools: Build vs. BuyBlog
A Funnel.io Alternative for Enhanced Reporting and AnalyticsTap Into It
START AUTOMATING YOUR MARKETING DATA TODAY!Try It Free
Schedule a Demo
No Credit Card Required.PRODUCTS
* Products
* Marketing Operations Platform* TapOrders
* TapWorkflow
* TapAnalytics
* TapReports
* Raven (SEM & SEO)
* TapFusion for GDS
* Competitive Intelligence * TapClicks Smart Connectors* Products __
* Marketing Operations Platform* TapOrders
* TapWorkflow
* TapAnalytics
* TapReports
* Raven (SEM & SEO)
* TapFusion for GDS
* Competitive Intelligence * TapClicks Smart Connectors__ Menu
* Products __
* Marketing Operations Platform* TapOrders
* TapWorkflow
* TapAnalytics
* TapReports
* Raven (SEM & SEO)
* TapFusion for GDS
* Competitive Intelligence * TapClicks Smart ConnectorsSOLUTIONS
* Solutions
* Media Companies
* Agencies
* Franchises
* Brands
* HIPAA for Healthcare* Packages
* Solutions __
* Media Companies
* Agencies
* Franchises
* Brands
* HIPAA for Healthcare* Packages
__ Menu
* Solutions __
* Media Companies
* Agencies
* Franchises
* Brands
* HIPAA for Healthcare* Packages
RESOURCES
* Resources
* What's On Tap
* Webinars
* Knowledge Base
* TapClicks Academy
* Instance Finder
* Resources __
* What's On Tap
* Webinars
* Knowledge Base
* TapClicks Academy
* Instance Finder
__ Menu
* Resources __
* What's On Tap
* Webinars
* Knowledge Base
* TapClicks Academy
* Instance Finder
COMPANY
* Company
* About Us
* Support
* Partners
* Careers
* Contact Us
* TapClicks UK
* Company __
* About Us
* Support
* Partners
* Careers
* Contact Us
* TapClicks UK
__ Menu
* Company __
* About Us
* Support
* Partners
* Careers
* Contact Us
* TapClicks UK
Privacy Policy | Website Terms of Use| Customer Terms
|
Partner Terms
TapClicks © 2020. All rights reserved.Facebook-f __
Twitter __
Instagram __
Linkedin __
Youtube __
__
__ Press enter to begin your searchBOOK A DEMO
×
+1
*
United States+1
*
India (भारत)+91*
*
Afghanistan (افغانستان)+93*
Albania (Shqipëri)+355*
Algeria (الجزائر)+213*
American Samoa+1
*
Andorra+376
*
Angola+244
*
Anguilla+1
*
Antigua and Barbuda+1*
Argentina+54
*
Armenia (Հայաստան)+374*
Aruba+297
*
Australia+61
*
Austria (Österreich)+43*
Azerbaijan (Azərbaycan)+994*
Bahamas+1
*
Bahrain (البحرين)+973*
Bangladesh (বাংলাদেশ)+880*
Barbados+1
*
Belarus (Беларусь)+375*
Belgium (België)+32*
Belize+501
*
Benin (Bénin)+229
*
Bermuda+1
*
Bhutan (འབྲུག)+975*
Bolivia+591
*
Bosnia and Herzegovina (Босна и Херцеговина)+387*
Botswana+267
*
Brazil (Brasil)+55
*
British Indian Ocean Territory+246*
British Virgin Islands+1*
Brunei+673
*
Bulgaria (България)+359*
Burkina Faso+226
*
Burundi (Uburundi)+257*
Cambodia (កម្ពុជា)+855*
Cameroon (Cameroun)+237*
Canada+1
*
Cape Verde (Kabu Verdi)+238*
Caribbean Netherlands+599*
Cayman Islands+1
*
Central African Republic (République centrafricaine)+236*
Chad (Tchad)+235
*
Chile+56
*
China (中国)+86
*
Christmas Island+61
*
Cocos (Keeling) Islands+61*
Colombia+57
*
Comoros (جزر القمر)+269*
Congo (DRC) (Jamhuri ya Kidemokrasia ya Kongo)+243*
Congo (Republic) (Congo-Brazzaville)+242*
Cook Islands+682
*
Costa Rica+506
*
Côte d’Ivoire+225*
Croatia (Hrvatska)+385*
Cuba+53
*
Curaçao+599
*
Cyprus (Κύπρος)+357*
Czech Republic (Česká republika)+420*
Denmark (Danmark)+45*
Djibouti+253
*
Dominica+1
*
Dominican Republic (República Dominicana)+1*
Ecuador+593
*
Egypt (مصر)+20*
El Salvador+503
*
Equatorial Guinea (Guinea Ecuatorial)+240*
Eritrea+291
*
Estonia (Eesti)+372
*
Ethiopia+251
*
Falkland Islands (Islas Malvinas)+500*
Faroe Islands (Føroyar)+298*
Fiji+679
*
Finland (Suomi)+358
*
France+33
*
French Guiana (Guyane française)+594*
French Polynesia (Polynésie française)+689*
Gabon+241
*
Gambia+220
*
Georgia (საქართველო)+995*
Germany (Deutschland)+49*
Ghana (Gaana)+233
*
Gibraltar+350
*
Greece (Ελλάδα)+30*
Greenland (Kalaallit Nunaat)+299*
Grenada+1
*
Guadeloupe+590
*
Guam+1
*
Guatemala+502
*
Guernsey+44
*
Guinea (Guinée)+224*
Guinea-Bissau (Guiné Bissau)+245*
Guyana+592
*
Haiti+509
*
Honduras+504
*
Hong Kong (香港)+852*
Hungary (Magyarország)+36*
Iceland (Ísland)+354*
India (भारत)+91*
Indonesia+62
*
Iran (ایران)+98*
Iraq (العراق)+964*
Ireland+353
*
Isle of Man+44
*
Israel (ישראל)+972*
Italy (Italia)+39
*
Jamaica+1
*
Japan (日本)+81
*
Jersey+44
*
Jordan (الأردن)+962*
Kazakhstan (Казахстан)+7*
Kenya+254
*
Kiribati+686
*
Kosovo+383
*
Kuwait (الكويت)+965*
Kyrgyzstan (Кыргызстан)+996*
Laos (ລາວ)+856*
Latvia (Latvija)+371*
Lebanon (لبنان)+961*
Lesotho+266
*
Liberia+231
*
Libya (ليبيا)+218*
Liechtenstein+423
*
Lithuania (Lietuva)+370*
Luxembourg+352
*
Macau (澳門)+853
*
Macedonia (FYROM) (Македонија)+389*
Madagascar (Madagasikara)+261*
Malawi+265
*
Malaysia+60
*
Maldives+960
*
Mali+223
*
Malta+356
*
Marshall Islands+692*
Martinique+596
*
Mauritania (موريتانيا)+222*
Mauritius (Moris)+230*
Mayotte+262
*
Mexico (México)+52
*
Micronesia+691
*
Moldova (Republica Moldova)+373*
Monaco+377
*
Mongolia (Монгол)+976*
Montenegro (Crna Gora)+382*
Montserrat+1
*
Morocco (المغرب)+212*
Mozambique (Moçambique)+258*
Myanmar (Burma) (မြန်မာ)+95*
Namibia (Namibië)+264*
Nauru+674
*
Nepal (नेपाल)+977*
Netherlands (Nederland)+31*
New Caledonia (Nouvelle-Calédonie)+687*
New Zealand+64
*
Nicaragua+505
*
Niger (Nijar)+227
*
Nigeria+234
*
Niue+683
*
Norfolk Island+672
*
North Korea (조선 민주주의 인민 공화국)+850*
Northern Mariana Islands+1*
Norway (Norge)+47
*
Oman (عُمان)+968*
Pakistan (پاکستان)+92*
Palau+680
*
Palestine (فلسطين)+970*
Panama (Panamá)+507*
Papua New Guinea+675*
Paraguay+595
*
Peru (Perú)+51
*
Philippines+63
*
Poland (Polska)+48
*
Portugal+351
*
Puerto Rico+1
*
Qatar (قطر)+974*
Réunion (La Réunion)+262*
Romania (România)+40*
Russia (Россия)+7*
Rwanda+250
*
Saint Barthélemy+590*
Saint Helena+290
*
Saint Kitts and Nevis+1*
Saint Lucia+1
*
Saint Martin (Saint-Martin (partie française))+590*
Saint Pierre and Miquelon (Saint-Pierre-et-Miquelon)+508*
Saint Vincent and the Grenadines+1*
Samoa+685
*
San Marino+378
*
São Tomé and Príncipe (São Tomé e Príncipe)+239*
Saudi Arabia (المملكة العربية السعودية)+966*
Senegal (Sénégal)+221*
Serbia (Србија)+381*
Seychelles+248
*
Sierra Leone+232
*
Singapore+65
*
Sint Maarten+1
*
Slovakia (Slovensko)+421*
Slovenia (Slovenija)+386*
Solomon Islands+677
*
Somalia (Soomaaliya)+252*
South Africa+27
*
South Korea (대한민국)+82*
South Sudan (جنوب السودان)+211*
Spain (España)+34
*
Sri Lanka (ශ්රී ලංකාව)+94*
Sudan (السودان)+249*
Suriname+597
*
Svalbard and Jan Mayen+47*
Swaziland+268
*
Sweden (Sverige)+46
*
Switzerland (Schweiz)+41*
Syria (سوريا)+963*
Taiwan (台灣)+886
*
Tajikistan+992
*
Tanzania+255
*
Thailand (ไทย)+66*
Timor-Leste+670
*
Togo+228
*
Tokelau+690
*
Tonga+676
*
Trinidad and Tobago+1*
Tunisia (تونس)+216*
Turkey (Türkiye)+90*
Turkmenistan+993
*
Turks and Caicos Islands+1*
Tuvalu+688
*
U.S. Virgin Islands+1*
Uganda+256
*
Ukraine (Україна)+380*
United Arab Emirates (الإمارات العربية المتحدة)+971*
United Kingdom+44
*
United States+1
*
Uruguay+598
*
Uzbekistan (Oʻzbekiston)+998*
Vanuatu+678
*
Vatican City (Città del Vaticano)+39*
Venezuela+58
*
Vietnam (Việt Nam)+84*
Wallis and Futuna (Wallis-et-Futuna)+681*
Western Sahara (الصحراء الغربية)+212*
Yemen (اليمن)+967*
Zambia+260
*
Zimbabwe+263
*
Åland Islands+358
Primary BusinessAdvertisingB2B EnterpriseConsultingCorporate BrandHealthcareDigital Marketing AgencyEducationInternet / Tech CompanyLodging & ResortsMedia CompanyMulti locationsNewspapersOtherPartnerPR AgencyPublic RelationsPublishingRadio/TVRetailSearch Engines & Internet PortalsSmall B2BSocial Media MarketingSoftware Development & Design Number of Employees1-1011-5051-100101-250251-500501-10001001-50005000+ When do you expect to buy?1-3 Months3-6 Months6-12 Months12+ Months I consent to storage and use of submitted data for purposes of responding to inquiries.Continue
Details
4