5
More Annotations


4


1
Favourite Annotations


4


4
Text
BUILD A FINANCIAL DATA DATABASE WITH 1) Flat-File Storage – this is simply a collection of individual files, usually csv files or similar, with each file containing data in a two-dimensional matrix or “table” structure with rows and
columns.
BOLLINGER BAND TRADING STRATEGY BACKTEST IN PYTHON So, after a long time without posting (been super busy), I thought I’d write a quick Bollinger Band Trading Strategy Backtest in Python and then run some optimisations and analysis much like we have done in the past.. It’s pretty easy and can be written in just a few lines of code, which is why I love Python so much – so many things can be quickly prototyped and tested to see if it even ICHIMOKU TRADING STRATEGY WITH PYTHON Ichimoku Trading Strategy With Python. I thought it was about time for another blog post, and this time I have decided to take a look at the “Ichimoku Kinko Hyo” trading strategy, or just “Ichimoku” strategy for short. The Ichimoku system is a Japanese charting and technical analysis method and was published in 1969 by a reporter inJapan.
MOVING AVERAGE CROSSOVER TRADING STRATEGY BACKTEST IN Hi all, for this post I will be building a simple moving average crossover trading strategy backtest in Python, using the S&P500 as the market to test on.. A simple moving average cross over strategy is possibly one of, if not the, simplest example of a rules based trading strategy using technical indicators so I thought this would be a good example for those learning Python; try to keep it as INVESTMENT PORTFOLIO OPTIMISATION WITH PYTHON In this post I’ll be looking at investment portfolio optimisation with python, the fundamental concept of diversification and the creation of an efficient frontier that can be used by investors to choose specific mixes of assets based on investment goals; that is, the trade off between their desired level of portfolio return vs their desired level of portfolio risk. MODELLING BID/OFFER SPREAD IN EQUITIES TRADING STRATEGY The strategy now ends up the period down around 25% as opposed to down 28% for the randomly sampled spread approach and down 45% for our model which applied half the average observed spread to each trade. I’m a believer in erring on the side of caution in general, and especially so when evaluating strategy backtests etc. STOCHASTIC OSCILLATOR TRADING STRATEGY BACKTEST IN PYTHON The stochastic oscillator is calculated using the following formula: %K = 100 (C – L14)/ (H14 – L14) Where: C = the most recent closing price. L14 = the low of the 14 previous trading sessions. H14 = the highest price traded during the same 14-day period. %K= the current market rate for the currency pair. %D = 3-period moving average of %K. JUPYTER NOTEBOOK PYTHON EXTENSIONS, THEMES AND ADDONS pip install jupyterthemes. Once we have the module correctly installed we can begin to use the relevant commands within ou notebook to change theme and styling elements. Let’s look at an example below. Firstly we run the command that lists out all the available themes: !jt -l. !jt -l. !jt -l. Available Themes: chesterish grade3 gruvboxd PYTHON MEAN REVERSION BACKTEST FOR ETFS This will entail a few distinct working parts. Firstly, we will need to download the relevant ETF ticker data from the database we created earlier, then create a list of ticker pairs out of that single list of tickers, which we can feed into the backtest function to work it’s magic. 4) We then need to run a regression on the price data MEAN REVERSION PAIRS TRADING WITH INCLUSION OF A KALMAN Mean Reversion Pairs Trading With Inclusion of a Kalman Filter. In this article we are going to revisit the concept of building a trading strategy backtest based on mean reverting, co-integrated pairs of stocks. So to restate the theory, stocks that are statistically co-integrated move in a way that means when their prices start todiverge by a
BUILD A FINANCIAL DATA DATABASE WITH 1) Flat-File Storage – this is simply a collection of individual files, usually csv files or similar, with each file containing data in a two-dimensional matrix or “table” structure with rows andcolumns.
BOLLINGER BAND TRADING STRATEGY BACKTEST IN PYTHON So, after a long time without posting (been super busy), I thought I’d write a quick Bollinger Band Trading Strategy Backtest in Python and then run some optimisations and analysis much like we have done in the past.. It’s pretty easy and can be written in just a few lines of code, which is why I love Python so much – so many things can be quickly prototyped and tested to see if it even ICHIMOKU TRADING STRATEGY WITH PYTHON Ichimoku Trading Strategy With Python. I thought it was about time for another blog post, and this time I have decided to take a look at the “Ichimoku Kinko Hyo” trading strategy, or just “Ichimoku” strategy for short. The Ichimoku system is a Japanese charting and technical analysis method and was published in 1969 by a reporter inJapan.
MOVING AVERAGE CROSSOVER TRADING STRATEGY BACKTEST IN Hi all, for this post I will be building a simple moving average crossover trading strategy backtest in Python, using the S&P500 as the market to test on.. A simple moving average cross over strategy is possibly one of, if not the, simplest example of a rules based trading strategy using technical indicators so I thought this would be a good example for those learning Python; try to keep it as INVESTMENT PORTFOLIO OPTIMISATION WITH PYTHON In this post I’ll be looking at investment portfolio optimisation with python, the fundamental concept of diversification and the creation of an efficient frontier that can be used by investors to choose specific mixes of assets based on investment goals; that is, the trade off between their desired level of portfolio return vs their desired level of portfolio risk. MODELLING BID/OFFER SPREAD IN EQUITIES TRADING STRATEGY The strategy now ends up the period down around 25% as opposed to down 28% for the randomly sampled spread approach and down 45% for our model which applied half the average observed spread to each trade. I’m a believer in erring on the side of caution in general, and especially so when evaluating strategy backtests etc. STOCHASTIC OSCILLATOR TRADING STRATEGY BACKTEST IN PYTHON The stochastic oscillator is calculated using the following formula: %K = 100 (C – L14)/ (H14 – L14) Where: C = the most recent closing price. L14 = the low of the 14 previous trading sessions. H14 = the highest price traded during the same 14-day period. %K= the current market rate for the currency pair. %D = 3-period moving average of %K. JUPYTER NOTEBOOK PYTHON EXTENSIONS, THEMES AND ADDONS pip install jupyterthemes. Once we have the module correctly installed we can begin to use the relevant commands within ou notebook to change theme and styling elements. Let’s look at an example below. Firstly we run the command that lists out all the available themes: !jt -l. !jt -l. !jt -l. Available Themes: chesterish grade3 gruvboxd PYTHON MEAN REVERSION BACKTEST FOR ETFS This will entail a few distinct working parts. Firstly, we will need to download the relevant ETF ticker data from the database we created earlier, then create a list of ticker pairs out of that single list of tickers, which we can feed into the backtest function to work it’s magic. 4) We then need to run a regression on the price data MEAN REVERSION PAIRS TRADING WITH INCLUSION OF A KALMAN Mean Reversion Pairs Trading With Inclusion of a Kalman Filter. In this article we are going to revisit the concept of building a trading strategy backtest based on mean reverting, co-integrated pairs of stocks. So to restate the theory, stocks that are statistically co-integrated move in a way that means when their prices start todiverge by a
PYTHON FOR FINANCE
The model assumes asset returns are normally distributed. It can generate unintuitive, highly-concentrated portfolios. The inputs to the model include each individual asset’s predicted/expected return and volatility, but we of course can never know those values for certain. Common practice is to calculate the assets’ historicreturns and
PYTHON FOR FINANCE
In this post I will be looking at a few things all combined into one script – you ‘ll see what I mean in a moment Being a blog about Python for finance, and having an admitted leaning towards scripting, backtesting and optimising systematic strategies I thought I would look at all three at the same timealong with the concept STOCHASTIC OSCILLATOR TRADING STRATEGY BACKTEST IN PYTHON The stochastic oscillator is calculated using the following formula: %K = 100 (C – L14)/ (H14 – L14) Where: C = the most recent closing price. L14 = the low of the 14 previous trading sessions. H14 = the highest price traded during the same 14-day period. %K= the current market rate for the currency pair. %D = 3-period moving average of %K. JUPYTER NOTEBOOK PYTHON EXTENSIONS, THEMES AND ADDONS pip install jupyterthemes. Once we have the module correctly installed we can begin to use the relevant commands within ou notebook to change theme and styling elements. Let’s look at an example below. Firstly we run the command that lists out all the available themes: !jt -l. !jt -l. !jt -l. Available Themes: chesterish grade3 gruvboxdPYTHON FOR FINANCE
Hi all, welcome back. This blog post is going to deal with creating the initial stages of our Python backtesting mean reversion script – we’re going to leave the “symbol pairs” function we created in the last post behind for a bit (we’ll come back to it a bit later) and use a single pair of symbols to run our first few stages of the backtest to keep it simple. PYTHON MEAN REVERSION BACKTEST FOR ETFS This will entail a few distinct working parts. Firstly, we will need to download the relevant ETF ticker data from the database we created earlier, then create a list of ticker pairs out of that single list of tickers, which we can feed into the backtest function to work it’s magic. 4) We then need to run a regression on the price data INTRADAY STOCK MEAN REVERSION TRADING BACKTEST IN PYTHON Once you have that file stored somewhere, we can feed it in using pandas, and set up our stock ticker list as follows: #make sure the NYSE.txt file is in the same folder as your python script file stocks = pd.read_csv('NYSE.txt',delimiter="\t") #set up our empty list to hold the stock tickers stocks_list = #iterate through the pandas dataframe of tickers and append them to our empty list STOCK RETURN HEATMAP USING SEABORN Creating a heatmap without stock ticker labels annotated, i.e. a heatmap annotated with just the numerical value of the relevant cell is a very easy process, thanks to the power and ease of use of Seaborn. It can be achieved as follows: #import relevant modules. import pandas as pd. import numpy as np. import pandas_datareader asdata.
OPTIMISATION OF MOVING AVERAGE CROSSOVER TRADING STRATEGY Optimisation of Moving Average Crossover Trading Strategy In Python. In that post we built a quick backtest that had the number of days used for the short moving average and the long moving average hard coded in at 42 and 252 days respectively. This is fine for a preliminary run to test our code and make sure it is runningcorrectly, but what
MULTI-THREADING TRADING STRATEGY BACK-TESTS AND MONTE def monte_carlo_strat(data,inputs,iters): #set number of days for each Monte Carlo simulation days = 252 #use the current inputs to backtest the strategy and record #various results metrics perf, sharpe, mu, sigma = ma_strat(data,inputs,inputs) #create two empty lists to store results of MC simulation mc_results = mc_results_final_val = # run the specified number of MC BUILD A FINANCIAL DATA DATABASE WITH 1) Flat-File Storage – this is simply a collection of individual files, usually csv files or similar, with each file containing data in a two-dimensional matrix or “table” structure with rows andcolumns.
BOLLINGER BAND TRADING STRATEGY BACKTEST IN PYTHON So, after a long time without posting (been super busy), I thought I’d write a quick Bollinger Band Trading Strategy Backtest in Python and then run some optimisations and analysis much like we have done in the past.. It’s pretty easy and can be written in just a few lines of code, which is why I love Python so much – so many things can be quickly prototyped and tested to see if it even MOVING AVERAGE CROSSOVER TRADING STRATEGY BACKTEST IN Hi all, for this post I will be building a simple moving average crossover trading strategy backtest in Python, using the S&P500 as the market to test on.. A simple moving average cross over strategy is possibly one of, if not the, simplest example of a rules based trading strategy using technical indicators so I thought this would be a good example for those learning Python; try to keep it as ICHIMOKU TRADING STRATEGY WITH PYTHON Ichimoku Trading Strategy With Python. I thought it was about time for another blog post, and this time I have decided to take a look at the “Ichimoku Kinko Hyo” trading strategy, or just “Ichimoku” strategy for short. The Ichimoku system is a Japanese charting and technical analysis method and was published in 1969 by a reporter inJapan.
MODELLING BID/OFFER SPREAD IN EQUITIES TRADING STRATEGY The strategy now ends up the period down around 25% as opposed to down 28% for the randomly sampled spread approach and down 45% for our model which applied half the average observed spread to each trade. I’m a believer in erring on the side of caution in general, and especially so when evaluating strategy backtests etc. INVESTMENT PORTFOLIO OPTIMISATION WITH PYTHON In this post I’ll be looking at investment portfolio optimisation with python, the fundamental concept of diversification and the creation of an efficient frontier that can be used by investors to choose specific mixes of assets based on investment goals; that is, the trade off between their desired level of portfolio return vs their desired level of portfolio risk. STOCHASTIC OSCILLATOR TRADING STRATEGY BACKTEST IN PYTHON The stochastic oscillator is calculated using the following formula: %K = 100 (C – L14)/ (H14 – L14) Where: C = the most recent closing price. L14 = the low of the 14 previous trading sessions. H14 = the highest price traded during the same 14-day period. %K= the current market rate for the currency pair. %D = 3-period moving average of %K. JUPYTER NOTEBOOK PYTHON EXTENSIONS, THEMES AND ADDONS pip install jupyterthemes. Once we have the module correctly installed we can begin to use the relevant commands within ou notebook to change theme and styling elements. Let’s look at an example below. Firstly we run the command that lists out all the available themes: !jt -l. !jt -l. !jt -l. Available Themes: chesterish grade3 gruvboxd MEAN REVERSION PAIRS TRADING WITH INCLUSION OF A KALMAN Mean Reversion Pairs Trading With Inclusion of a Kalman Filter. In this article we are going to revisit the concept of building a trading strategy backtest based on mean reverting, co-integrated pairs of stocks. So to restate the theory, stocks that are statistically co-integrated move in a way that means when their prices start todiverge by a
MULTI-THREADING TRADING STRATEGY BACK-TESTS AND MONTE def monte_carlo_strat(data,inputs,iters): #set number of days for each Monte Carlo simulation days = 252 #use the current inputs to backtest the strategy and record #various results metrics perf, sharpe, mu, sigma = ma_strat(data,inputs,inputs) #create two empty lists to store results of MC simulation mc_results = mc_results_final_val = # run the specified number of MCPYTHON FOR FINANCE
The model assumes asset returns are normally distributed. It can generate unintuitive, highly-concentrated portfolios. The inputs to the model include each individual asset’s predicted/expected return and volatility, but we of course can never know those values for certain. Common practice is to calculate the assets’ historicreturns and
STOCHASTIC OSCILLATOR TRADING STRATEGY BACKTEST IN PYTHON The stochastic oscillator is calculated using the following formula: %K = 100 (C – L14)/ (H14 – L14) Where: C = the most recent closing price. L14 = the low of the 14 previous trading sessions. H14 = the highest price traded during the same 14-day period. %K= the current market rate for the currency pair. %D = 3-period moving average of %K. MEAN REVERSION PAIRS TRADING WITH INCLUSION OF A KALMAN Mean Reversion Pairs Trading With Inclusion of a Kalman Filter. In this article we are going to revisit the concept of building a trading strategy backtest based on mean reverting, co-integrated pairs of stocks. So to restate the theory, stocks that are statistically co-integrated move in a way that means when their prices start todiverge by a
MULTI-THREADING TRADING STRATEGY BACK-TESTS AND MONTE def monte_carlo_strat(data,inputs,iters): #set number of days for each Monte Carlo simulation days = 252 #use the current inputs to backtest the strategy and record #various results metrics perf, sharpe, mu, sigma = ma_strat(data,inputs,inputs) #create two empty lists to store results of MC simulation mc_results = mc_results_final_val = # run the specified number of MC PYTHON MEAN REVERSION BACKTEST FOR ETFS This will entail a few distinct working parts. Firstly, we will need to download the relevant ETF ticker data from the database we created earlier, then create a list of ticker pairs out of that single list of tickers, which we can feed into the backtest function to work it’s magic. 4) We then need to run a regression on the price data STOCK CLUSTERS USING K-MEANS ALGORITHM IN PYTHON For this post, I will be creating a script to download pricing data for the S&P 500 stocks, calculate their historic returns and volatility and then proceed to use the K-Means clustering algorithm to divide the stocks into distinct groups based upon said returns andvolatilities.
INTRADAY STOCK MEAN REVERSION TRADING BACKTEST IN PYTHON The strategy rules are as follows: 1) Select all stocks near the market open whose returns from their previous day’s lows to today’s opens are lower than one standard deviation. The standard deviation is computed using the daily close-to-close returns of OPTIMISATION OF MOVING AVERAGE CROSSOVER TRADING STRATEGY Optimisation of Moving Average Crossover Trading Strategy In Python. In that post we built a quick backtest that had the number of days used for the short moving average and the long moving average hard coded in at 42 and 252 days respectively. This is fine for a preliminary run to test our code and make sure it is runningcorrectly, but what
TRADING STRATEGY PERFORMANCE REPORT IN PYTHON Trading Strategy Performance Report in Python – Part 4. by s666 3 February 2019. written by s666 3 February 2019. Well it’s time for part 4 of our mini-series outlining how to create a program to generate performance reports in nice, fancy looking HTML format that we can render in our browser and interact with (to a certain extent). TRADING STRATEGY ANALYSIS USING PYTHON AND THE FFN PACKAGE Trading Strategy Analysis using Python and the FFN Package – Part 2. Hi all, this is the second part to the “Trading Strategy Analysis using Python and the FFN Package” post (the first part can be found here ). Last time we went over the use of the “PerformanceStats” object in ffn, whereas this time I want to concentrate on the BUILD A FINANCIAL DATA DATABASE WITH 1) Flat-File Storage – this is simply a collection of individual files, usually csv files or similar, with each file containing data in a two-dimensional matrix or “table” structure with rows andcolumns.
BOLLINGER BAND TRADING STRATEGY BACKTEST IN PYTHON So, after a long time without posting (been super busy), I thought I’d write a quick Bollinger Band Trading Strategy Backtest in Python and then run some optimisations and analysis much like we have done in the past.. It’s pretty easy and can be written in just a few lines of code, which is why I love Python so much – so many things can be quickly prototyped and tested to see if it even MOVING AVERAGE CROSSOVER TRADING STRATEGY BACKTEST IN Hi all, for this post I will be building a simple moving average crossover trading strategy backtest in Python, using the S&P500 as the market to test on.. A simple moving average cross over strategy is possibly one of, if not the, simplest example of a rules based trading strategy using technical indicators so I thought this would be a good example for those learning Python; try to keep it as ICHIMOKU TRADING STRATEGY WITH PYTHON Ichimoku Trading Strategy With Python. I thought it was about time for another blog post, and this time I have decided to take a look at the “Ichimoku Kinko Hyo” trading strategy, or just “Ichimoku” strategy for short. The Ichimoku system is a Japanese charting and technical analysis method and was published in 1969 by a reporter inJapan.
MODELLING BID/OFFER SPREAD IN EQUITIES TRADING STRATEGY The strategy now ends up the period down around 25% as opposed to down 28% for the randomly sampled spread approach and down 45% for our model which applied half the average observed spread to each trade. I’m a believer in erring on the side of caution in general, and especially so when evaluating strategy backtests etc. INVESTMENT PORTFOLIO OPTIMISATION WITH PYTHON In this post I’ll be looking at investment portfolio optimisation with python, the fundamental concept of diversification and the creation of an efficient frontier that can be used by investors to choose specific mixes of assets based on investment goals; that is, the trade off between their desired level of portfolio return vs their desired level of portfolio risk. STOCHASTIC OSCILLATOR TRADING STRATEGY BACKTEST IN PYTHON The stochastic oscillator is calculated using the following formula: %K = 100 (C – L14)/ (H14 – L14) Where: C = the most recent closing price. L14 = the low of the 14 previous trading sessions. H14 = the highest price traded during the same 14-day period. %K= the current market rate for the currency pair. %D = 3-period moving average of %K. JUPYTER NOTEBOOK PYTHON EXTENSIONS, THEMES AND ADDONS pip install jupyterthemes. Once we have the module correctly installed we can begin to use the relevant commands within ou notebook to change theme and styling elements. Let’s look at an example below. Firstly we run the command that lists out all the available themes: !jt -l. !jt -l. !jt -l. Available Themes: chesterish grade3 gruvboxd MEAN REVERSION PAIRS TRADING WITH INCLUSION OF A KALMAN Mean Reversion Pairs Trading With Inclusion of a Kalman Filter. In this article we are going to revisit the concept of building a trading strategy backtest based on mean reverting, co-integrated pairs of stocks. So to restate the theory, stocks that are statistically co-integrated move in a way that means when their prices start todiverge by a
MULTI-THREADING TRADING STRATEGY BACK-TESTS AND MONTE def monte_carlo_strat(data,inputs,iters): #set number of days for each Monte Carlo simulation days = 252 #use the current inputs to backtest the strategy and record #various results metrics perf, sharpe, mu, sigma = ma_strat(data,inputs,inputs) #create two empty lists to store results of MC simulation mc_results = mc_results_final_val = # run the specified number of MC BUILD A FINANCIAL DATA DATABASE WITH 1) Flat-File Storage – this is simply a collection of individual files, usually csv files or similar, with each file containing data in a two-dimensional matrix or “table” structure with rows andcolumns.
BOLLINGER BAND TRADING STRATEGY BACKTEST IN PYTHON So, after a long time without posting (been super busy), I thought I’d write a quick Bollinger Band Trading Strategy Backtest in Python and then run some optimisations and analysis much like we have done in the past.. It’s pretty easy and can be written in just a few lines of code, which is why I love Python so much – so many things can be quickly prototyped and tested to see if it even MOVING AVERAGE CROSSOVER TRADING STRATEGY BACKTEST IN Hi all, for this post I will be building a simple moving average crossover trading strategy backtest in Python, using the S&P500 as the market to test on.. A simple moving average cross over strategy is possibly one of, if not the, simplest example of a rules based trading strategy using technical indicators so I thought this would be a good example for those learning Python; try to keep it as ICHIMOKU TRADING STRATEGY WITH PYTHON Ichimoku Trading Strategy With Python. I thought it was about time for another blog post, and this time I have decided to take a look at the “Ichimoku Kinko Hyo” trading strategy, or just “Ichimoku” strategy for short. The Ichimoku system is a Japanese charting and technical analysis method and was published in 1969 by a reporter inJapan.
MODELLING BID/OFFER SPREAD IN EQUITIES TRADING STRATEGY The strategy now ends up the period down around 25% as opposed to down 28% for the randomly sampled spread approach and down 45% for our model which applied half the average observed spread to each trade. I’m a believer in erring on the side of caution in general, and especially so when evaluating strategy backtests etc. INVESTMENT PORTFOLIO OPTIMISATION WITH PYTHON In this post I’ll be looking at investment portfolio optimisation with python, the fundamental concept of diversification and the creation of an efficient frontier that can be used by investors to choose specific mixes of assets based on investment goals; that is, the trade off between their desired level of portfolio return vs their desired level of portfolio risk. STOCHASTIC OSCILLATOR TRADING STRATEGY BACKTEST IN PYTHON The stochastic oscillator is calculated using the following formula: %K = 100 (C – L14)/ (H14 – L14) Where: C = the most recent closing price. L14 = the low of the 14 previous trading sessions. H14 = the highest price traded during the same 14-day period. %K= the current market rate for the currency pair. %D = 3-period moving average of %K. JUPYTER NOTEBOOK PYTHON EXTENSIONS, THEMES AND ADDONS pip install jupyterthemes. Once we have the module correctly installed we can begin to use the relevant commands within ou notebook to change theme and styling elements. Let’s look at an example below. Firstly we run the command that lists out all the available themes: !jt -l. !jt -l. !jt -l. Available Themes: chesterish grade3 gruvboxd MEAN REVERSION PAIRS TRADING WITH INCLUSION OF A KALMAN Mean Reversion Pairs Trading With Inclusion of a Kalman Filter. In this article we are going to revisit the concept of building a trading strategy backtest based on mean reverting, co-integrated pairs of stocks. So to restate the theory, stocks that are statistically co-integrated move in a way that means when their prices start todiverge by a
MULTI-THREADING TRADING STRATEGY BACK-TESTS AND MONTE def monte_carlo_strat(data,inputs,iters): #set number of days for each Monte Carlo simulation days = 252 #use the current inputs to backtest the strategy and record #various results metrics perf, sharpe, mu, sigma = ma_strat(data,inputs,inputs) #create two empty lists to store results of MC simulation mc_results = mc_results_final_val = # run the specified number of MCPYTHON FOR FINANCE
The model assumes asset returns are normally distributed. It can generate unintuitive, highly-concentrated portfolios. The inputs to the model include each individual asset’s predicted/expected return and volatility, but we of course can never know those values for certain. Common practice is to calculate the assets’ historicreturns and
STOCHASTIC OSCILLATOR TRADING STRATEGY BACKTEST IN PYTHON The stochastic oscillator is calculated using the following formula: %K = 100 (C – L14)/ (H14 – L14) Where: C = the most recent closing price. L14 = the low of the 14 previous trading sessions. H14 = the highest price traded during the same 14-day period. %K= the current market rate for the currency pair. %D = 3-period moving average of %K. MEAN REVERSION PAIRS TRADING WITH INCLUSION OF A KALMAN Mean Reversion Pairs Trading With Inclusion of a Kalman Filter. In this article we are going to revisit the concept of building a trading strategy backtest based on mean reverting, co-integrated pairs of stocks. So to restate the theory, stocks that are statistically co-integrated move in a way that means when their prices start todiverge by a
MULTI-THREADING TRADING STRATEGY BACK-TESTS AND MONTE def monte_carlo_strat(data,inputs,iters): #set number of days for each Monte Carlo simulation days = 252 #use the current inputs to backtest the strategy and record #various results metrics perf, sharpe, mu, sigma = ma_strat(data,inputs,inputs) #create two empty lists to store results of MC simulation mc_results = mc_results_final_val = # run the specified number of MC PYTHON MEAN REVERSION BACKTEST FOR ETFS This will entail a few distinct working parts. Firstly, we will need to download the relevant ETF ticker data from the database we created earlier, then create a list of ticker pairs out of that single list of tickers, which we can feed into the backtest function to work it’s magic. 4) We then need to run a regression on the price data STOCK CLUSTERS USING K-MEANS ALGORITHM IN PYTHON For this post, I will be creating a script to download pricing data for the S&P 500 stocks, calculate their historic returns and volatility and then proceed to use the K-Means clustering algorithm to divide the stocks into distinct groups based upon said returns andvolatilities.
INTRADAY STOCK MEAN REVERSION TRADING BACKTEST IN PYTHON The strategy rules are as follows: 1) Select all stocks near the market open whose returns from their previous day’s lows to today’s opens are lower than one standard deviation. The standard deviation is computed using the daily close-to-close returns of OPTIMISATION OF MOVING AVERAGE CROSSOVER TRADING STRATEGY Optimisation of Moving Average Crossover Trading Strategy In Python. In that post we built a quick backtest that had the number of days used for the short moving average and the long moving average hard coded in at 42 and 252 days respectively. This is fine for a preliminary run to test our code and make sure it is runningcorrectly, but what
TRADING STRATEGY PERFORMANCE REPORT IN PYTHON Trading Strategy Performance Report in Python – Part 4. by s666 3 February 2019. written by s666 3 February 2019. Well it’s time for part 4 of our mini-series outlining how to create a program to generate performance reports in nice, fancy looking HTML format that we can render in our browser and interact with (to a certain extent). TRADING STRATEGY ANALYSIS USING PYTHON AND THE FFN PACKAGE Trading Strategy Analysis using Python and the FFN Package – Part 2. Hi all, this is the second part to the “Trading Strategy Analysis using Python and the FFN Package” post (the first part can be found here ). Last time we went over the use of the “PerformanceStats” object in ffn, whereas this time I want to concentrate on thePYTHON FOR FINANCE
The model assumes asset returns are normally distributed. It can generate unintuitive, highly-concentrated portfolios. The inputs to the model include each individual asset’s predicted/expected return and volatility, but we of course can never know those values for certain. Common practice is to calculate the assets’ historicreturns and
TRADING STRATEGY BACKTEST Optimisation of Moving Average Crossover Trading Strategy In Python. In that post we built a quick backtest that had the number of days used for the short moving average and the long moving average hard coded in at 42 and 252 days respectively. This is fine for a preliminary run to test our code and make sure it is runningcorrectly, but what
INVESTMENT PORTFOLIO OPTIMISATION WITH PYTHON In this post I’ll be looking at investment portfolio optimisation with python, the fundamental concept of diversification and the creation of an efficient frontier that can be used by investors to choose specific mixes of assets based on investment goals; that is, the trade off between their desired level of portfolio return vs their desired level of portfolio risk. MODELLING BID/OFFER SPREAD IN EQUITIES TRADING STRATEGY The strategy now ends up the period down around 25% as opposed to down 28% for the randomly sampled spread approach and down 45% for our model which applied half the average observed spread to each trade. I’m a believer in erring on the side of caution in general, and especially so when evaluating strategy backtests etc. MOVING AVERAGE CROSSOVER TRADING STRATEGY BACKTEST INMOVING AVERAGE IN PYTHONEXPONENTIAL MOVING AVERAGE PYTHONPLOT MOVING AVERAGE PYTHONPYTHON MOVING AVERAGE CODEPYTHON MOVING AVERAGE MODELSIMPLE MOVING AVERAGE FORMULA Hi all, for this post I will be building a simple moving average crossover trading strategy backtest in Python, using the S&P500 as the market to test on.. A simple moving average cross over strategy is possibly one of, if not the, simplest example of a rules based trading strategy using technical indicators so I thought this would be a good example for those learning Python; try to keep it as EQUITIES MARKET INTRADAY MOMENTUM STRATEGY IN PYTHONIMPORT YFINANCE PYTHONPYTHON YFINANCE SYMBOL NOT WORKINGYFINANCE PYTHON EXAMPLES Equities Market Intraday Momentum Strategy in Python – Part 1. For this post, I want to take a look at the concept of intra-day momentum and investigate whether we are able to identify any positive signs of such a phenomenon occurring across (quite a large) universe of NYSE stocks. It has been suggested that, for the wider market in general STOCHASTIC OSCILLATOR TRADING STRATEGY BACKTEST IN PYTHON The stochastic oscillator is calculated using the following formula: %K = 100 (C – L14)/ (H14 – L14) Where: C = the most recent closing price. L14 = the low of the 14 previous trading sessions. H14 = the highest price traded during the same 14-day period. %K= the current market rate for the currency pair. %D = 3-period moving average of %K. BOLLINGER BAND TRADING STRATEGY BACKTEST IN PYTHONINSTALL NUMPY PYTHONNUMPY PYTHON PACKAGE So, after a long time without posting (been super busy), I thought I’d write a quick Bollinger Band Trading Strategy Backtest in Python and then run some optimisations and analysis much like we have done in the past.. It’s pretty easy and can be written in just a few lines of code, which is why I love Python so much – so many things can be quickly prototyped and tested to see if it even MEAN REVERSION PAIRS TRADING WITH INCLUSION OF A KALMAN Mean Reversion Pairs Trading With Inclusion of a Kalman Filter. In this article we are going to revisit the concept of building a trading strategy backtest based on mean reverting, co-integrated pairs of stocks. So to restate the theory, stocks that are statistically co-integrated move in a way that means when their prices start todiverge by a
PYTHON MEAN REVERSION BACKTEST FOR ETFS This will entail a few distinct working parts. Firstly, we will need to download the relevant ETF ticker data from the database we created earlier, then create a list of ticker pairs out of that single list of tickers, which we can feed into the backtest function to work it’s magic. 4) We then need to run a regression on the price dataPYTHON FOR FINANCE
The model assumes asset returns are normally distributed. It can generate unintuitive, highly-concentrated portfolios. The inputs to the model include each individual asset’s predicted/expected return and volatility, but we of course can never know those values for certain. Common practice is to calculate the assets’ historicreturns and
TRADING STRATEGY BACKTEST Optimisation of Moving Average Crossover Trading Strategy In Python. In that post we built a quick backtest that had the number of days used for the short moving average and the long moving average hard coded in at 42 and 252 days respectively. This is fine for a preliminary run to test our code and make sure it is runningcorrectly, but what
INVESTMENT PORTFOLIO OPTIMISATION WITH PYTHON In this post I’ll be looking at investment portfolio optimisation with python, the fundamental concept of diversification and the creation of an efficient frontier that can be used by investors to choose specific mixes of assets based on investment goals; that is, the trade off between their desired level of portfolio return vs their desired level of portfolio risk. MODELLING BID/OFFER SPREAD IN EQUITIES TRADING STRATEGY The strategy now ends up the period down around 25% as opposed to down 28% for the randomly sampled spread approach and down 45% for our model which applied half the average observed spread to each trade. I’m a believer in erring on the side of caution in general, and especially so when evaluating strategy backtests etc. MOVING AVERAGE CROSSOVER TRADING STRATEGY BACKTEST INMOVING AVERAGE IN PYTHONEXPONENTIAL MOVING AVERAGE PYTHONPLOT MOVING AVERAGE PYTHONPYTHON MOVING AVERAGE CODEPYTHON MOVING AVERAGE MODELSIMPLE MOVING AVERAGE FORMULA Hi all, for this post I will be building a simple moving average crossover trading strategy backtest in Python, using the S&P500 as the market to test on.. A simple moving average cross over strategy is possibly one of, if not the, simplest example of a rules based trading strategy using technical indicators so I thought this would be a good example for those learning Python; try to keep it as EQUITIES MARKET INTRADAY MOMENTUM STRATEGY IN PYTHONIMPORT YFINANCE PYTHONPYTHON YFINANCE SYMBOL NOT WORKINGYFINANCE PYTHON EXAMPLES Equities Market Intraday Momentum Strategy in Python – Part 1. For this post, I want to take a look at the concept of intra-day momentum and investigate whether we are able to identify any positive signs of such a phenomenon occurring across (quite a large) universe of NYSE stocks. It has been suggested that, for the wider market in general STOCHASTIC OSCILLATOR TRADING STRATEGY BACKTEST IN PYTHON The stochastic oscillator is calculated using the following formula: %K = 100 (C – L14)/ (H14 – L14) Where: C = the most recent closing price. L14 = the low of the 14 previous trading sessions. H14 = the highest price traded during the same 14-day period. %K= the current market rate for the currency pair. %D = 3-period moving average of %K. BOLLINGER BAND TRADING STRATEGY BACKTEST IN PYTHONINSTALL NUMPY PYTHONNUMPY PYTHON PACKAGE So, after a long time without posting (been super busy), I thought I’d write a quick Bollinger Band Trading Strategy Backtest in Python and then run some optimisations and analysis much like we have done in the past.. It’s pretty easy and can be written in just a few lines of code, which is why I love Python so much – so many things can be quickly prototyped and tested to see if it even MEAN REVERSION PAIRS TRADING WITH INCLUSION OF A KALMAN Mean Reversion Pairs Trading With Inclusion of a Kalman Filter. In this article we are going to revisit the concept of building a trading strategy backtest based on mean reverting, co-integrated pairs of stocks. So to restate the theory, stocks that are statistically co-integrated move in a way that means when their prices start todiverge by a
PYTHON MEAN REVERSION BACKTEST FOR ETFS This will entail a few distinct working parts. Firstly, we will need to download the relevant ETF ticker data from the database we created earlier, then create a list of ticker pairs out of that single list of tickers, which we can feed into the backtest function to work it’s magic. 4) We then need to run a regression on the price data BUILD A FINANCIAL DATA DATABASE WITH 1) Flat-File Storage – this is simply a collection of individual files, usually csv files or similar, with each file containing data in a two-dimensional matrix or “table” structure with rows andcolumns.
DATA ANALYSIS
The model assumes asset returns are normally distributed. It can generate unintuitive, highly-concentrated portfolios. The inputs to the model include each individual asset’s predicted/expected return and volatility, but we of course can never know those values for certain. Common practice is to calculate the assets’ historicreturns and
BEGINNERS RESOURCES
Learn Python for finance, trading and data analysis –the journey begins! by s666 17 March 2016. I will be posting here regarding my journey to learn Python for use in designing and building automated trading strategies, along with general data analysis and perhaps (eventually) some web based python involving Flask and Django.PYTHON FOR FINANCE
Trading Strategy Performance Report in Python – Part 2. This is the second part of the current “mini-series” providing a walk-through of how to create a “Report Generation” tool to allow the creation and display of a performance report for our (backtest) strategy equityseries/returns.
INVESTMENT PORTFOLIO OPTIMISATION WITH PYTHON Investment Portfolio Optimisation with Python – Revisited. In this post I am going to be looking at portfolio optimisation methods, touching on both the use of Monte Carlo, “brute force” style optimisation and then the use of Scipy’s “optimize” function for “minimizing (or maximizing) objective functions, possibly subject to PYTHONFORFINANCE.NET pythonforfinance.net STOCHASTIC OSCILLATOR TRADING STRATEGY BACKTEST IN PYTHON The stochastic oscillator is calculated using the following formula: %K = 100 (C – L14)/ (H14 – L14) Where: C = the most recent closing price. L14 = the low of the 14 previous trading sessions. H14 = the highest price traded during the same 14-day period. %K= the current market rate for the currency pair. %D = 3-period moving average of %K. BOLLINGER BAND TRADING STRATEGY BACKTEST IN PYTHON So, after a long time without posting (been super busy), I thought I’d write a quick Bollinger Band Trading Strategy Backtest in Python and then run some optimisations and analysis much like we have done in the past.. It’s pretty easy and can be written in just a few lines of code, which is why I love Python so much – so many things can be quickly prototyped and tested to see if it even MULTI-THREADING TRADING STRATEGY BACK-TESTS AND MONTE def monte_carlo_strat(data,inputs,iters): #set number of days for each Monte Carlo simulation days = 252 #use the current inputs to backtest the strategy and record #various results metrics perf, sharpe, mu, sigma = ma_strat(data,inputs,inputs) #create two empty lists to store results of MC simulation mc_results = mc_results_final_val = # run the specified number of MC WHAT ARE ‘SKEW’ LOOKIN’ AT? Skewness is a measure of the symmetry in a distribution. A symmetrical dataset will have a skewness equal to 0. So, a normal distribution will have a skewness of 0. Skewness essentially measures the relative size of the two tails. Kurtosis is a measure of the combined sizes of the two tails. It measures the amount of probability in the tails.PYTHON FOR FINANCE
The model assumes asset returns are normally distributed. It can generate unintuitive, highly-concentrated portfolios. The inputs to the model include each individual asset’s predicted/expected return and volatility, but we of course can never know those values for certain. Common practice is to calculate the assets’ historicreturns and
TRADING STRATEGY BACKTEST Optimisation of Moving Average Crossover Trading Strategy In Python. In that post we built a quick backtest that had the number of days used for the short moving average and the long moving average hard coded in at 42 and 252 days respectively. This is fine for a preliminary run to test our code and make sure it is runningcorrectly, but what
INVESTMENT PORTFOLIO OPTIMISATION WITH PYTHON In this post I’ll be looking at investment portfolio optimisation with python, the fundamental concept of diversification and the creation of an efficient frontier that can be used by investors to choose specific mixes of assets based on investment goals; that is, the trade off between their desired level of portfolio return vs their desired level of portfolio risk. MODELLING BID/OFFER SPREAD IN EQUITIES TRADING STRATEGY The strategy now ends up the period down around 25% as opposed to down 28% for the randomly sampled spread approach and down 45% for our model which applied half the average observed spread to each trade. I’m a believer in erring on the side of caution in general, and especially so when evaluating strategy backtests etc. MOVING AVERAGE CROSSOVER TRADING STRATEGY BACKTEST INMOVING AVERAGE IN PYTHONEXPONENTIAL MOVING AVERAGE PYTHONPLOT MOVING AVERAGE PYTHONPYTHON MOVING AVERAGE CODEPYTHON MOVING AVERAGE MODELSIMPLE MOVING AVERAGE FORMULA Hi all, for this post I will be building a simple moving average crossover trading strategy backtest in Python, using the S&P500 as the market to test on.. A simple moving average cross over strategy is possibly one of, if not the, simplest example of a rules based trading strategy using technical indicators so I thought this would be a good example for those learning Python; try to keep it as EQUITIES MARKET INTRADAY MOMENTUM STRATEGY IN PYTHONIMPORT YFINANCE PYTHONPYTHON YFINANCE SYMBOL NOT WORKINGYFINANCE PYTHON EXAMPLES Equities Market Intraday Momentum Strategy in Python – Part 1. For this post, I want to take a look at the concept of intra-day momentum and investigate whether we are able to identify any positive signs of such a phenomenon occurring across (quite a large) universe of NYSE stocks. It has been suggested that, for the wider market in general STOCHASTIC OSCILLATOR TRADING STRATEGY BACKTEST IN PYTHON The stochastic oscillator is calculated using the following formula: %K = 100 (C – L14)/ (H14 – L14) Where: C = the most recent closing price. L14 = the low of the 14 previous trading sessions. H14 = the highest price traded during the same 14-day period. %K= the current market rate for the currency pair. %D = 3-period moving average of %K. BOLLINGER BAND TRADING STRATEGY BACKTEST IN PYTHONINSTALL NUMPY PYTHONNUMPY PYTHON PACKAGE So, after a long time without posting (been super busy), I thought I’d write a quick Bollinger Band Trading Strategy Backtest in Python and then run some optimisations and analysis much like we have done in the past.. It’s pretty easy and can be written in just a few lines of code, which is why I love Python so much – so many things can be quickly prototyped and tested to see if it even MEAN REVERSION PAIRS TRADING WITH INCLUSION OF A KALMAN Mean Reversion Pairs Trading With Inclusion of a Kalman Filter. In this article we are going to revisit the concept of building a trading strategy backtest based on mean reverting, co-integrated pairs of stocks. So to restate the theory, stocks that are statistically co-integrated move in a way that means when their prices start todiverge by a
PYTHON MEAN REVERSION BACKTEST FOR ETFS This will entail a few distinct working parts. Firstly, we will need to download the relevant ETF ticker data from the database we created earlier, then create a list of ticker pairs out of that single list of tickers, which we can feed into the backtest function to work it’s magic. 4) We then need to run a regression on the price dataPYTHON FOR FINANCE
The model assumes asset returns are normally distributed. It can generate unintuitive, highly-concentrated portfolios. The inputs to the model include each individual asset’s predicted/expected return and volatility, but we of course can never know those values for certain. Common practice is to calculate the assets’ historicreturns and
TRADING STRATEGY BACKTEST Optimisation of Moving Average Crossover Trading Strategy In Python. In that post we built a quick backtest that had the number of days used for the short moving average and the long moving average hard coded in at 42 and 252 days respectively. This is fine for a preliminary run to test our code and make sure it is runningcorrectly, but what
INVESTMENT PORTFOLIO OPTIMISATION WITH PYTHON In this post I’ll be looking at investment portfolio optimisation with python, the fundamental concept of diversification and the creation of an efficient frontier that can be used by investors to choose specific mixes of assets based on investment goals; that is, the trade off between their desired level of portfolio return vs their desired level of portfolio risk. MODELLING BID/OFFER SPREAD IN EQUITIES TRADING STRATEGY The strategy now ends up the period down around 25% as opposed to down 28% for the randomly sampled spread approach and down 45% for our model which applied half the average observed spread to each trade. I’m a believer in erring on the side of caution in general, and especially so when evaluating strategy backtests etc. MOVING AVERAGE CROSSOVER TRADING STRATEGY BACKTEST INMOVING AVERAGE IN PYTHONEXPONENTIAL MOVING AVERAGE PYTHONPLOT MOVING AVERAGE PYTHONPYTHON MOVING AVERAGE CODEPYTHON MOVING AVERAGE MODELSIMPLE MOVING AVERAGE FORMULA Hi all, for this post I will be building a simple moving average crossover trading strategy backtest in Python, using the S&P500 as the market to test on.. A simple moving average cross over strategy is possibly one of, if not the, simplest example of a rules based trading strategy using technical indicators so I thought this would be a good example for those learning Python; try to keep it as EQUITIES MARKET INTRADAY MOMENTUM STRATEGY IN PYTHONIMPORT YFINANCE PYTHONPYTHON YFINANCE SYMBOL NOT WORKINGYFINANCE PYTHON EXAMPLES Equities Market Intraday Momentum Strategy in Python – Part 1. For this post, I want to take a look at the concept of intra-day momentum and investigate whether we are able to identify any positive signs of such a phenomenon occurring across (quite a large) universe of NYSE stocks. It has been suggested that, for the wider market in general STOCHASTIC OSCILLATOR TRADING STRATEGY BACKTEST IN PYTHON The stochastic oscillator is calculated using the following formula: %K = 100 (C – L14)/ (H14 – L14) Where: C = the most recent closing price. L14 = the low of the 14 previous trading sessions. H14 = the highest price traded during the same 14-day period. %K= the current market rate for the currency pair. %D = 3-period moving average of %K. BOLLINGER BAND TRADING STRATEGY BACKTEST IN PYTHONINSTALL NUMPY PYTHONNUMPY PYTHON PACKAGE So, after a long time without posting (been super busy), I thought I’d write a quick Bollinger Band Trading Strategy Backtest in Python and then run some optimisations and analysis much like we have done in the past.. It’s pretty easy and can be written in just a few lines of code, which is why I love Python so much – so many things can be quickly prototyped and tested to see if it even MEAN REVERSION PAIRS TRADING WITH INCLUSION OF A KALMAN Mean Reversion Pairs Trading With Inclusion of a Kalman Filter. In this article we are going to revisit the concept of building a trading strategy backtest based on mean reverting, co-integrated pairs of stocks. So to restate the theory, stocks that are statistically co-integrated move in a way that means when their prices start todiverge by a
PYTHON MEAN REVERSION BACKTEST FOR ETFS This will entail a few distinct working parts. Firstly, we will need to download the relevant ETF ticker data from the database we created earlier, then create a list of ticker pairs out of that single list of tickers, which we can feed into the backtest function to work it’s magic. 4) We then need to run a regression on the price data BUILD A FINANCIAL DATA DATABASE WITH 1) Flat-File Storage – this is simply a collection of individual files, usually csv files or similar, with each file containing data in a two-dimensional matrix or “table” structure with rows andcolumns.
DATA ANALYSIS
The model assumes asset returns are normally distributed. It can generate unintuitive, highly-concentrated portfolios. The inputs to the model include each individual asset’s predicted/expected return and volatility, but we of course can never know those values for certain. Common practice is to calculate the assets’ historicreturns and
BEGINNERS RESOURCES
Learn Python for finance, trading and data analysis –the journey begins! by s666 17 March 2016. I will be posting here regarding my journey to learn Python for use in designing and building automated trading strategies, along with general data analysis and perhaps (eventually) some web based python involving Flask and Django.PYTHON FOR FINANCE
Trading Strategy Performance Report in Python – Part 2. This is the second part of the current “mini-series” providing a walk-through of how to create a “Report Generation” tool to allow the creation and display of a performance report for our (backtest) strategy equityseries/returns.
INVESTMENT PORTFOLIO OPTIMISATION WITH PYTHON Investment Portfolio Optimisation with Python – Revisited. In this post I am going to be looking at portfolio optimisation methods, touching on both the use of Monte Carlo, “brute force” style optimisation and then the use of Scipy’s “optimize” function for “minimizing (or maximizing) objective functions, possibly subject to PYTHONFORFINANCE.NET pythonforfinance.net STOCHASTIC OSCILLATOR TRADING STRATEGY BACKTEST IN PYTHON The stochastic oscillator is calculated using the following formula: %K = 100 (C – L14)/ (H14 – L14) Where: C = the most recent closing price. L14 = the low of the 14 previous trading sessions. H14 = the highest price traded during the same 14-day period. %K= the current market rate for the currency pair. %D = 3-period moving average of %K. BOLLINGER BAND TRADING STRATEGY BACKTEST IN PYTHON So, after a long time without posting (been super busy), I thought I’d write a quick Bollinger Band Trading Strategy Backtest in Python and then run some optimisations and analysis much like we have done in the past.. It’s pretty easy and can be written in just a few lines of code, which is why I love Python so much – so many things can be quickly prototyped and tested to see if it even MULTI-THREADING TRADING STRATEGY BACK-TESTS AND MONTE def monte_carlo_strat(data,inputs,iters): #set number of days for each Monte Carlo simulation days = 252 #use the current inputs to backtest the strategy and record #various results metrics perf, sharpe, mu, sigma = ma_strat(data,inputs,inputs) #create two empty lists to store results of MC simulation mc_results = mc_results_final_val = # run the specified number of MC WHAT ARE ‘SKEW’ LOOKIN’ AT? Skewness is a measure of the symmetry in a distribution. A symmetrical dataset will have a skewness equal to 0. So, a normal distribution will have a skewness of 0. Skewness essentially measures the relative size of the two tails. Kurtosis is a measure of the combined sizes of the two tails. It measures the amount of probability in the tails.__
__ __
__
__
__
__
* Home
* Resources
* Contact Us
__
* Home
* Resources
* Contact Us
__
__
__ __
__
__
__
__
PYTHON, FINANCE AND GETTING THEM TO PLAY NICELY TOGETHER...Data Analysis
Trading
Strategy Backtest
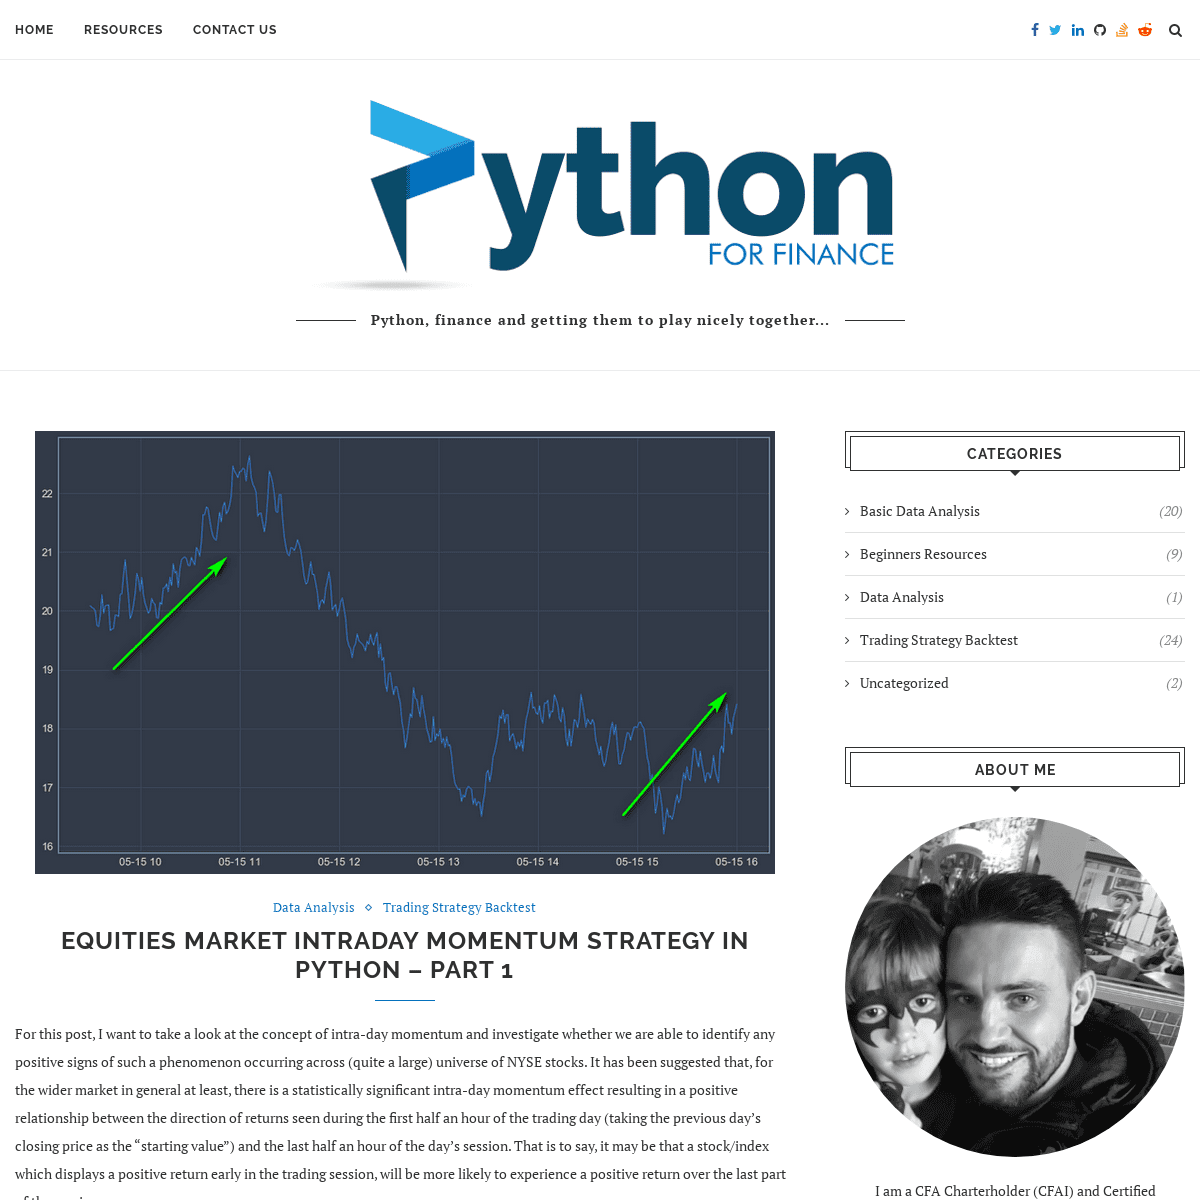
EQUITIES MARKET INTRADAY MOMENTUM STRATEGY IN PYTHON – PART 1 by s666 October 23,2019
For this post, I want to take a look at the concept of intra-day momentum and investigate whether we are able to identify any positive signs of such a phenomenon occurring across (quite a large) universe of NYSE stocks. It has been suggested that, for the wider market in general at least, there is a statistically significant intra-day momentum effect resulting in a positive relationship between the direction of returns seen during the first half an hour of the trading day (taking the previous day’s closing price as the “starting value”) and the last half an hour of the day’s session. That is to say, it may be that a stock/index which displays a positive return early in the trading session, will be more likely to experience a positive return over the last part of the session. The effect seems to have been first identified/posited by Gao, Han, Li and Zhou in their 2015 research paper (https://papers.ssrn.com/sol3/papers.cfm?abstract_id=2440866). In their research paper, they specifically look at high-frequency data regarding the S&P 500 ETF, and they test over 20 years’ worth of data – so it’s worth pointing out that I am going the “other way” somewhat. Where their study lacked depth (number of instruments studied), my data contains around 3000 individual stocks, however, where they tested over a long time period (20 years) my data spansonly 1 year.
I have a feeling already that the mechanisms and forces that move the “overall market” and result in certain price patterns and behaviours, may not necessarily translate exactly over into the individual constituent stocks. We can but try…Continue Reading
__October 23, 2019 __3 comments__0 __Facebook
__Twitter
__Pinterest__Linkedin__Reddit
__Whatsapp
__Telegram
__Email *
Trading Strategy Backtest MODELLING BID/OFFER SPREAD IN EQUITIES TRADING STRATEGY BACKTEST by s666 October 13,2019
by s666 October 13,2019
In this blog post I wanted to run a couple of quick experiments to see how clearly I was able to highlight the importance of incorporating various elements and components into a backtest that I admittedly often overlook in most of my posts – that is I make the assumption that they will be dealt with by the reader at…Read more__
*
Basic Data Analysis
TIME SERIES DECOMPOSITION & PREDICTION IN PYTHON by s666 July 22, 2019 by s666 July 22, 2019 In this article I wanted to concentrate on some basic time series analysis, and on efforts to see if there is any simple way we can improve our prediction skills and abilities in order to produce more accurate results. When considering most financial asset price time series you would be forgiven for concluding that, at various time frames (some longer,…Read more__
*
Beginners Resources
Uncategorized
JUPYTER NOTEBOOK PYTHON EXTENSIONS, THEMES AND ADDONS by s666 July 7, 2019 by s666 July 7, 2019 I thought today I would whip up a quick post regarding Jupyter Notebooks and how to download, install and use various “addons” that I like using and find more than just a little bit useful. Among other things I’ll show how to use the “jupyter-themes” module to change and manipulate the basic theme and styling of the overallnotebook, I’ll…
Read more__
*
Basic Data Analysis
INVESTMENT PORTFOLIO OPTIMISATION WITH PYTHON – REVISITED by s666 July 2, 2019 by s666 July 2, 2019 In this post I am going to be looking at portfolio optimisation methods, touching on both the use of Monte Carlo, “brute force” style optimisation and then the use of Scipy’s “optimize” function for “minimizing (or maximizing) objective functions, possibly subject to constraints”, as it states in the official docs (https://docs.scipy.org/doc/scipy/reference/optimize.html). I have to apologise at this point for my…Read more__
*
Trading Strategy Backtest ICHIMOKU TRADING STRATEGY WITH PYTHON – PART 2 by s666 June 27, 2019 by s666 June 27, 2019 This is part 2 of the Ichimoku Strategy creation and backtest – with part 1 having dealt with the calculation and creation of the individual Ichimoku elements (which can be found here), we now move onto creating the actual trading strategy logic and subsequent backtest. The Ichimoku approach concerns itself with two major elements – firstly the signals and insights…Read more__
*
Trading Strategy Backtest ICHIMOKU TRADING STRATEGY WITH PYTHON by s666 June 26, 2019 by s666 June 26, 2019 I thought it was about time for another blog post, and this time I have decided to take a look at the “Ichimoku Kinko Hyo” trading strategy, or just “Ichimoku” strategy for short. The Ichimoku system is a Japanese charting and technical analysis method and was published in 1969 by a reporter in Japan. I thought I would spendthis…
Read more__
*
Basic Data Analysis
PYTHON MONTE CARLO VS BOOTSTRAPPING by s666 May 30, 2019 by s666 May 30, 2019 In this article I thought I would take a look at and compare the concepts of “Monte Carlo analysis” and “Bootstrapping” in relation to simulating returns series and generating corresponding confidence intervals as to a portfolio’s potential risks and rewards. Both methods are used to generate simulated price paths for a given asset, or portfolio of assets but they use…Read more__
*
Basic Data Analysis
Beginners
Resources
DATA ANALYSIS WITH PANDAS AND CUSTOMISED VISUALS WITH MATPLOTLIBby s666 April 30,
2019
by s666 April 30,
2019
This blog post is a result of a request I received on the website Facebook group page from a follower who asked me to analyse/play around with a csv data file he had provided. The request was to use Pandas to wrangle the data and perform some filtering and aggregation, with the view to plot the resulting figures using Matplotlib.…Read more__
*
Trading Strategy Backtest MULTI-THREADING TRADING STRATEGY BACK-TESTS AND MONTE CARLO SIMULATIONS IN PYTHONby s666 April 19,
2019
by s666 April 19,
2019
In this post I will be looking at a few things all combined into one script – you ‘ll see what I mean in a moment… Being a blog about Python for finance, and having an admitted leaning towards scripting, backtesting and optimising systematic strategies I thought I would look at all three at the same time…along with the concept…Read more__
* 1
* 2
* 3
* …
* 5
* __
CATEGORIES
* Basic Data Analysis (20) * Beginners Resources (9)* Data Analysis (1)
* Trading Strategy Backtest (24)* Uncategorized (2)
ABOUT ME
I am a CFA Charterholder (CFAI) and Certified Financial Risk Manager (GARP) with over 16 years experience as a financial derivatives trader in London. Finance / Machine Learning / Data Visualization / Data Science Consultant I am mostly interested in projects related to data science, data visualization, data engineering and machine learning, especially those related to finance. HIRE ME ON PEOPLE PER HOURARCHIVES
* October 2019 (2)* July 2019 (3)
* June 2019 (2)
* May 2019 (1)
* April 2019 (2)
* February 2019 (1) * January 2019 (5) * December 2018 (1) * September 2018 (1)* July 2018 (3)
* June 2018 (1)
* March 2018 (1)
* February 2018 (3) * October 2017 (1)* July 2017 (1)
* February 2017 (2) * January 2017 (2) * December 2016 (1) * November 2016 (1) * September 2016 (2)* July 2016 (2)
* May 2016 (1)
* April 2016 (4)
* March 2016 (4)
* __Facebook
* __Twitter
* __Linkedin
* __Github
* __Stack-Overflow
* __Reddit
@2019 - All Rights Reserved PythonForFinance.net__
Back To Top
Details
5