6
More Annotations


6


6
Favourite Annotations


2


4
Text
OREGON OFFICE OF ECONOMIC ANALYSIS A complicating factor here is we do not actually know what underlying income growth is for the typical family today. Real-time national estimates for median household income dropped a little bit during the recession and have grown slowly in the past 6-9 months. I am using that income pattern underneath the numbers shown in the chart above for the affordability calculations. HOW FROTHY IS THE HOUSING MARKET? A one percent decline in rates offsets roughly a 13 percent increase in purchase price, while maintaining the same monthly mortgage payment. This means if a household was looking to buy a $400,000 home pre-pandemic, they could afford a $450,000 home during the pandemic. A $500,000 budget became a $565,000 budget, and so on. OREGON ECONOMIC AND REVENUE FORECAST, MAY 2021 This afternoon the Oregon Office of Economic Analysis released the latest quarterly economic and revenue forecast. For the full document, slides and forecast data please see our main website. Below is the forecast’s Executive Summary and a copy of our presentation slides. Economic growth is surging as the pandemic wanes. Thanks to federal
fiscal policy,
COVID-19: SMALL BUSINESS SURVIVAL AND PPP Recessions always change the economy. Even as jobs, income, and profits return and surpass the previous peak, the underlying structure of the economy is different than it was prior to the recession. In technical terms, something like GDP fails the unit root test even if activity and growth returns to it's long-run trend, at least CHECKING IN ON PORTLAND Checking in on Portland. Large urban economies have tended to suffer the most during the pandemic. Portland has been no exception. If we look at the latest employment data here in Oregon it shows that Multnomah County has the largest job losses in the state relative to pre-COVID peaks*. Much of the urban losses can be tied directly tothings
OLDER WORKERS AND RETIREMENTS Our office takes a bit of a more holistic view of retirement in Oregon — we count anyone 60 years and older who is out of the labor force for whatever reason, in part because the splitting the already small sample into the different possible answers yields some noisy results. Even so, we know retirements have been large in recent years. OREGON ECONOMIC AND REVENUE FORECAST, MARCH 2021 This afternoon the Oregon Office of Economic Analysis released the latest quarterly economic and revenue forecast. For the full document, slides and forecast data please see our main website. Below is the forecast’s Executive Summary and a copy of our presentation slides. The economy is emerging from a dark winter. The resurgent virus of a SO FAR FEWER BUSINESS CLOSURES THAN EXPECTED Our office remains very concerned about business closures and permanent layoffs. The more of this economic scarring that accumulates before the recovery can truly get underway will weigh on the strength of that recovery. The pandemic has impacted all aspects of the economy to varying degrees. Small business in particular appear the mostvulnerable as
OREGON REACHES A GRIM POPULATION MILESTONE Oregon Reaches a Grim Population Milestone. I hope the pandemic progress Graph of the Week cheered you up a bit heading into last weekend because I’m here to bring you back to earth with some new data. The Oregon Health Authority just updated the monthly vital statistics — births and deaths — through December. ECONOMIC TRENDS OF THE 2010S (GRAPHS OF THE DECADE Economic Trends of the 2010s (Graphs of the Decade) Economically, the 2010s were a disappointment. Now, the U.S. economy went the full 10 years without a recession, a first in history. However we began the decade at the bottom of the worst recession in a long time. As such much of the decade was about regaining the lost ground. OREGON OFFICE OF ECONOMIC ANALYSIS A complicating factor here is we do not actually know what underlying income growth is for the typical family today. Real-time national estimates for median household income dropped a little bit during the recession and have grown slowly in the past 6-9 months. I am using that income pattern underneath the numbers shown in the chart above for the affordability calculations. HOW FROTHY IS THE HOUSING MARKET? A one percent decline in rates offsets roughly a 13 percent increase in purchase price, while maintaining the same monthly mortgage payment. This means if a household was looking to buy a $400,000 home pre-pandemic, they could afford a $450,000 home during the pandemic. A $500,000 budget became a $565,000 budget, and so on. OREGON ECONOMIC AND REVENUE FORECAST, MAY 2021 This afternoon the Oregon Office of Economic Analysis released the latest quarterly economic and revenue forecast. For the full document, slides and forecast data please see our main website. Below is the forecast’s Executive Summary and a copy of our presentation slides. Economic growth is surging as the pandemic wanes. Thanks to federalfiscal policy,
COVID-19: SMALL BUSINESS SURVIVAL AND PPP Recessions always change the economy. Even as jobs, income, and profits return and surpass the previous peak, the underlying structure of the economy is different than it was prior to the recession. In technical terms, something like GDP fails the unit root test even if activity and growth returns to it's long-run trend, at least CHECKING IN ON PORTLAND Checking in on Portland. Large urban economies have tended to suffer the most during the pandemic. Portland has been no exception. If we look at the latest employment data here in Oregon it shows that Multnomah County has the largest job losses in the state relative to pre-COVID peaks*. Much of the urban losses can be tied directly tothings
OLDER WORKERS AND RETIREMENTS Our office takes a bit of a more holistic view of retirement in Oregon — we count anyone 60 years and older who is out of the labor force for whatever reason, in part because the splitting the already small sample into the different possible answers yields some noisy results. Even so, we know retirements have been large in recent years. OREGON ECONOMIC AND REVENUE FORECAST, MARCH 2021 This afternoon the Oregon Office of Economic Analysis released the latest quarterly economic and revenue forecast. For the full document, slides and forecast data please see our main website. Below is the forecast’s Executive Summary and a copy of our presentation slides. The economy is emerging from a dark winter. The resurgent virus of a SO FAR FEWER BUSINESS CLOSURES THAN EXPECTED Our office remains very concerned about business closures and permanent layoffs. The more of this economic scarring that accumulates before the recovery can truly get underway will weigh on the strength of that recovery. The pandemic has impacted all aspects of the economy to varying degrees. Small business in particular appear the mostvulnerable as
OREGON REACHES A GRIM POPULATION MILESTONE Oregon Reaches a Grim Population Milestone. I hope the pandemic progress Graph of the Week cheered you up a bit heading into last weekend because I’m here to bring you back to earth with some new data. The Oregon Health Authority just updated the monthly vital statistics — births and deaths — through December. ECONOMIC TRENDS OF THE 2010S (GRAPHS OF THE DECADE Economic Trends of the 2010s (Graphs of the Decade) Economically, the 2010s were a disappointment. Now, the U.S. economy went the full 10 years without a recession, a first in history. However we began the decade at the bottom of the worst recession in a long time. As such much of the decade was about regaining the lost ground. GROWTH IN A SUPPLY-CONSTRAINED ECONOMY Economic growth is surging as the pandemic wanes. Thanks to federal fiscal policy, consumers have higher incomes today than before COVID-19 hit. Now they are increasingly allowed to and feel comfortable resuming pandemic-restricted activities like going out to eat, on vacations, getting haircuts and the like. The outlook for near-term economic growth is the strongest WHY OREGON’S LABOR MARKET IS TIGHTER THAN YOU THINK This morning the Oregon Employment Department and the Oregon Office of Economic Analysis are releasing a joint article on the current state of the labor market and why it may be harder for businesses to find workers than you might think. Download OREGON EMPLOYMENT, MARCH 2021 This morning the Oregon Employment Department released the March 2021 jobs report. Overall the new data shows what we are expecting is the beginning of a robust recovery. Last month Oregon saw more than 20,000 jobs added. Most of the gains were in Leisure and Hospitality as the economy continued to reopen and Oregonians returned FUN FRIDAY: NORTHWEST CIGARETTE SALES The cigarette tax per pack was increased $2, going from $1.33 to $3.33. Oregon’s cigarette taxes are now higher than Washington’s, at least leaving to the side the impact of Washington’s retail sales tax (which has always existed). If historical patterns hold, Oregon cigarette sales will drop noticeably this year, while they will likely MIGRATION TO OREGON, AN UPDATE Even as migration flows returned in the recent years, Oregon is a larger place today so the growth rate remains lower than what we saw in the 1970s and 1990s. In terms of who moves to Oregon, it is important to keep in mind that migration is for the young. This goes for both those moving into Oregon and those moving out of state. OREGON’S OLDER POPULATION: A STATISTICAL PROFILE 795,635. Projected number of people 65 and older in 2020. Elderly will comprise 18.3 percent of the total population in 2020. Between 2009 and 2020, the elderly population will increase by 57 percent or 4.1 percent annually, on average. The pace of growth of the elderly population will be 4 times that of the overall population. HISTORICAL LOOK AT OREGON’S WOOD PRODUCT INDUSTRY This post, first published in 2012 has been updated with new charts over time. A full set of slides from the 2019 update are included at the bottom of this post. This post takes a high-level look at historical trends in Oregon's Wood Products industry in terms OREGON, DIVERSITY AND THE MIDDLE EAST Oregon, Diversity and the Middle East. People have been moving to Oregon in droves ever since Lewis and Clark*. This fact is a foundational statement in our office’s presentations and one of the key reasons Oregon’s economy outperforms the typical state over the business cycle. As our office has pointed out in the past, Oregon is VEHICLE MILES TRAVELED, AGE EDITION Our office oversees the state's Highway Cost Allocation Study each biennium and one of the topics discussed, obviously, is the issue of vehicle miles traveled. Nationally VMT is effectively flat, while VMT per capita is down. In Oregon we've seen similar, yet more pronounced, trends. One contributor to this decline is the fact that younger OREGON WAGES, A 2017 UPDATE Oregon Wages, A 2017 Update. The labor market is tight, the share of prime working-age Oregonians with a job is back to mid-2000s rates across all levels of educational attainment. While this is certainly good news, the question our office is being asked more and more is about wage growth. We have a lot of jobs, but what about wages? OREGON OFFICE OF ECONOMIC ANALYSIS A complicating factor here is we do not actually know what underlying income growth is for the typical family today. Real-time national estimates for median household income dropped a little bit during the recession and have grown slowly in the past 6-9 months. I am using that income pattern underneath the numbers shown in the chart above for the affordability calculations. HOW FROTHY IS THE HOUSING MARKET? A one percent decline in rates offsets roughly a 13 percent increase in purchase price, while maintaining the same monthly mortgage payment. This means if a household was looking to buy a $400,000 home pre-pandemic, they could afford a $450,000 home during the pandemic. A $500,000 budget became a $565,000 budget, and so on. COVID-19: SMALL BUSINESS SURVIVAL AND PPP Recessions always change the economy. Even as jobs, income, and profits return and surpass the previous peak, the underlying structure of the economy is different than it was prior to the recession. In technical terms, something like GDP fails the unit root test even if activity and growth returns to it's long-run trend, at leastJOSH LEHNER
Josh develops the quarterly Oregon Economic forecast, including outlooks for employment, income and housing. Additional responsibilities include the Oregon Index of CHECKING IN ON PORTLAND Checking in on Portland. Large urban economies have tended to suffer the most during the pandemic. Portland has been no exception. If we look at the latest employment data here in Oregon it shows that Multnomah County has the largest job losses in the state relative to pre-COVID peaks*. Much of the urban losses can be tied directly tothings
SO FAR FEWER BUSINESS CLOSURES THAN EXPECTED Our office remains very concerned about business closures and permanent layoffs. The more of this economic scarring that accumulates before the recovery can truly get underway will weigh on the strength of that recovery. The pandemic has impacted all aspects of the economy to varying degrees. Small business in particular appear the mostvulnerable as
POPULATION, DEMOGRAPHICS AND GENERATIONS First, a recent PEW report discussed how Millennials are now the largest generation in the U.S., overtaking their parents, the Baby Boomers. The same is generally true here in Oregon as well, although using our definition of generations, Millennials overtook Boomers back in 2008. This is in large part due to Oregon’s strong in-migration MARIJUANA DEMAND, SUPPLY AND SUBSTITUTION Notes on three new marijuana research pieces that has come out recently. First, 2017 state level estimates of drug and alcohol use were released this week. What it shows is a continuation of trends related to marijuana use in the past decade. States with legal recreational and medical marijuana generally see the highest usagerates
HOUSING AND RELATED INDUSTRIES In case you missed it, Part 1 of this series looked at housing demand fundamentals and demographics and Part 2 examined housing affordability. Today in Part 3 I will introduce a new-to-me-at-least and improved measure of housing and related industries. Our office has routinely discussed housing related employment in the past few years,particularly as
OREGON WAGES, A 2017 UPDATE Oregon Wages, A 2017 Update. The labor market is tight, the share of prime working-age Oregonians with a job is back to mid-2000s rates across all levels of educational attainment. While this is certainly good news, the question our office is being asked more and more is about wage growth. We have a lot of jobs, but what about wages? OREGON OFFICE OF ECONOMIC ANALYSIS A complicating factor here is we do not actually know what underlying income growth is for the typical family today. Real-time national estimates for median household income dropped a little bit during the recession and have grown slowly in the past 6-9 months. I am using that income pattern underneath the numbers shown in the chart above for the affordability calculations. HOW FROTHY IS THE HOUSING MARKET? A one percent decline in rates offsets roughly a 13 percent increase in purchase price, while maintaining the same monthly mortgage payment. This means if a household was looking to buy a $400,000 home pre-pandemic, they could afford a $450,000 home during the pandemic. A $500,000 budget became a $565,000 budget, and so on. COVID-19: SMALL BUSINESS SURVIVAL AND PPP Recessions always change the economy. Even as jobs, income, and profits return and surpass the previous peak, the underlying structure of the economy is different than it was prior to the recession. In technical terms, something like GDP fails the unit root test even if activity and growth returns to it's long-run trend, at leastJOSH LEHNER
Josh develops the quarterly Oregon Economic forecast, including outlooks for employment, income and housing. Additional responsibilities include the Oregon Index of CHECKING IN ON PORTLAND Checking in on Portland. Large urban economies have tended to suffer the most during the pandemic. Portland has been no exception. If we look at the latest employment data here in Oregon it shows that Multnomah County has the largest job losses in the state relative to pre-COVID peaks*. Much of the urban losses can be tied directly tothings
SO FAR FEWER BUSINESS CLOSURES THAN EXPECTED Our office remains very concerned about business closures and permanent layoffs. The more of this economic scarring that accumulates before the recovery can truly get underway will weigh on the strength of that recovery. The pandemic has impacted all aspects of the economy to varying degrees. Small business in particular appear the mostvulnerable as
POPULATION, DEMOGRAPHICS AND GENERATIONS First, a recent PEW report discussed how Millennials are now the largest generation in the U.S., overtaking their parents, the Baby Boomers. The same is generally true here in Oregon as well, although using our definition of generations, Millennials overtook Boomers back in 2008. This is in large part due to Oregon’s strong in-migration MARIJUANA DEMAND, SUPPLY AND SUBSTITUTION Notes on three new marijuana research pieces that has come out recently. First, 2017 state level estimates of drug and alcohol use were released this week. What it shows is a continuation of trends related to marijuana use in the past decade. States with legal recreational and medical marijuana generally see the highest usagerates
HOUSING AND RELATED INDUSTRIES In case you missed it, Part 1 of this series looked at housing demand fundamentals and demographics and Part 2 examined housing affordability. Today in Part 3 I will introduce a new-to-me-at-least and improved measure of housing and related industries. Our office has routinely discussed housing related employment in the past few years,particularly as
OREGON WAGES, A 2017 UPDATE Oregon Wages, A 2017 Update. The labor market is tight, the share of prime working-age Oregonians with a job is back to mid-2000s rates across all levels of educational attainment. While this is certainly good news, the question our office is being asked more and more is about wage growth. We have a lot of jobs, but what about wages? GROWTH IN A SUPPLY-CONSTRAINED ECONOMY Economic growth is surging as the pandemic wanes. Thanks to federal fiscal policy, consumers have higher incomes today than before COVID-19 hit. Now they are increasingly allowed to and feel comfortable resuming pandemic-restricted activities like going out to eat, on vacations, getting haircuts and the like. The outlook for near-term economic growth is the strongest OREGON ECONOMIC AND REVENUE FORECAST, MAY 2021 This afternoon the Oregon Office of Economic Analysis released the latest quarterly economic and revenue forecast. For the full document, slides and forecast data please see our main website. Below is the forecast’s Executive Summary and a copy of our presentation slides. Economic growth is surging as the pandemic wanes. Thanks to federalfiscal policy,
MAY | 2021 | OREGON OFFICE OF ECONOMIC ANALYSIS Oregon Economic and Revenue Forecast, May 2021. Posted by: Josh Lehneron May 19, 2021.
SO FAR FEWER BUSINESS CLOSURES THAN EXPECTED Our office remains very concerned about business closures and permanent layoffs. The more of this economic scarring that accumulates before the recovery can truly get underway will weigh on the strength of that recovery. The pandemic has impacted all aspects of the economy to varying degrees. Small business in particular appear the mostvulnerable as
ZOOM TOWNS ARE REAL (GRAPH OF THE WEEK) Zoom Towns are Real (Graph of the Week) Stories about pandemic migration and working from home abound, even as we are months away from any hard data. This can be a struggle, balancing these anecdotes and speculation when we lack any real OLDER WORKERS AND RETIREMENTS Our office takes a bit of a more holistic view of retirement in Oregon — we count anyone 60 years and older who is out of the labor force for whatever reason, in part because the splitting the already small sample into the different possible answers yields some noisy results. Even so, we know retirements have been large in recent years. OREGON CONSTRUCTION OUTLOOK, DEC 2020 Oregon Construction Outlook, Dec 2020. Typically, construction is a more volatile sector than the overall economy. It falls further in recessions, but bounces back stronger in expansion. New residential construction historically has been a great leading indicator with it’s declines starting ahead of full-blown recessions, andrebounding
OREGON’S INCOME DISTRIBUTION Oregon's income gains this expansion are among the best in the nation, as our office has highlighted in recent years. The state's median household income now matches the U.S. for the first time since the mills started closing in the 1980s. The single largest factor underlying this growth is the strong labor market. For individuals OREGON’S OLDER POPULATION: A STATISTICAL PROFILE 795,635. Projected number of people 65 and older in 2020. Elderly will comprise 18.3 percent of the total population in 2020. Between 2009 and 2020, the elderly population will increase by 57 percent or 4.1 percent annually, on average. The pace of growth of the elderly population will be 4 times that of the overall population. COLUMBIA RIVER GORGE The next installment of the regional series takes a look at the Columbia Gorge and Mid-Columbia counties. This region has been the best performer, in both employment and unemployment terms, this business cycle and provides an interesting contrast with the previous post on Central Oregon, the worst regional performer this cycle. Inkeeping with the
OREGON OFFICE OF ECONOMIC ANALYSIS A complicating factor here is we do not actually know what underlying income growth is for the typical family today. Real-time national estimates for median household income dropped a little bit during the recession and have grown slowly in the past 6-9 months. I am using that income pattern underneath the numbers shown in the chart above for the affordability calculations. HOW FROTHY IS THE HOUSING MARKET? A one percent decline in rates offsets roughly a 13 percent increase in purchase price, while maintaining the same monthly mortgage payment. This means if a household was looking to buy a $400,000 home pre-pandemic, they could afford a $450,000 home during the pandemic. A $500,000 budget became a $565,000 budget, and so on. COVID-19: SMALL BUSINESS SURVIVAL AND PPP Recessions always change the economy. Even as jobs, income, and profits return and surpass the previous peak, the underlying structure of the economy is different than it was prior to the recession. In technical terms, something like GDP fails the unit root test even if activity and growth returns to it's long-run trend, at leastJOSH LEHNER
Josh develops the quarterly Oregon Economic forecast, including outlooks for employment, income and housing. Additional responsibilities include the Oregon Index of CHECKING IN ON PORTLAND Checking in on Portland. Large urban economies have tended to suffer the most during the pandemic. Portland has been no exception. If we look at the latest employment data here in Oregon it shows that Multnomah County has the largest job losses in the state relative to pre-COVID peaks*. Much of the urban losses can be tied directly tothings
SO FAR FEWER BUSINESS CLOSURES THAN EXPECTED Our office remains very concerned about business closures and permanent layoffs. The more of this economic scarring that accumulates before the recovery can truly get underway will weigh on the strength of that recovery. The pandemic has impacted all aspects of the economy to varying degrees. Small business in particular appear the mostvulnerable as
POPULATION, DEMOGRAPHICS AND GENERATIONS First, a recent PEW report discussed how Millennials are now the largest generation in the U.S., overtaking their parents, the Baby Boomers. The same is generally true here in Oregon as well, although using our definition of generations, Millennials overtook Boomers back in 2008. This is in large part due to Oregon’s strong in-migration MARIJUANA DEMAND, SUPPLY AND SUBSTITUTION Notes on three new marijuana research pieces that has come out recently. First, 2017 state level estimates of drug and alcohol use were released this week. What it shows is a continuation of trends related to marijuana use in the past decade. States with legal recreational and medical marijuana generally see the highest usagerates
HOUSING AND RELATED INDUSTRIES In case you missed it, Part 1 of this series looked at housing demand fundamentals and demographics and Part 2 examined housing affordability. Today in Part 3 I will introduce a new-to-me-at-least and improved measure of housing and related industries. Our office has routinely discussed housing related employment in the past few years,particularly as
OREGON WAGES, A 2017 UPDATE Oregon Wages, A 2017 Update. The labor market is tight, the share of prime working-age Oregonians with a job is back to mid-2000s rates across all levels of educational attainment. While this is certainly good news, the question our office is being asked more and more is about wage growth. We have a lot of jobs, but what about wages? OREGON OFFICE OF ECONOMIC ANALYSIS A complicating factor here is we do not actually know what underlying income growth is for the typical family today. Real-time national estimates for median household income dropped a little bit during the recession and have grown slowly in the past 6-9 months. I am using that income pattern underneath the numbers shown in the chart above for the affordability calculations. HOW FROTHY IS THE HOUSING MARKET? A one percent decline in rates offsets roughly a 13 percent increase in purchase price, while maintaining the same monthly mortgage payment. This means if a household was looking to buy a $400,000 home pre-pandemic, they could afford a $450,000 home during the pandemic. A $500,000 budget became a $565,000 budget, and so on. COVID-19: SMALL BUSINESS SURVIVAL AND PPP Recessions always change the economy. Even as jobs, income, and profits return and surpass the previous peak, the underlying structure of the economy is different than it was prior to the recession. In technical terms, something like GDP fails the unit root test even if activity and growth returns to it's long-run trend, at leastJOSH LEHNER
Josh develops the quarterly Oregon Economic forecast, including outlooks for employment, income and housing. Additional responsibilities include the Oregon Index of CHECKING IN ON PORTLAND Checking in on Portland. Large urban economies have tended to suffer the most during the pandemic. Portland has been no exception. If we look at the latest employment data here in Oregon it shows that Multnomah County has the largest job losses in the state relative to pre-COVID peaks*. Much of the urban losses can be tied directly tothings
SO FAR FEWER BUSINESS CLOSURES THAN EXPECTED Our office remains very concerned about business closures and permanent layoffs. The more of this economic scarring that accumulates before the recovery can truly get underway will weigh on the strength of that recovery. The pandemic has impacted all aspects of the economy to varying degrees. Small business in particular appear the mostvulnerable as
POPULATION, DEMOGRAPHICS AND GENERATIONS First, a recent PEW report discussed how Millennials are now the largest generation in the U.S., overtaking their parents, the Baby Boomers. The same is generally true here in Oregon as well, although using our definition of generations, Millennials overtook Boomers back in 2008. This is in large part due to Oregon’s strong in-migration MARIJUANA DEMAND, SUPPLY AND SUBSTITUTION Notes on three new marijuana research pieces that has come out recently. First, 2017 state level estimates of drug and alcohol use were released this week. What it shows is a continuation of trends related to marijuana use in the past decade. States with legal recreational and medical marijuana generally see the highest usagerates
HOUSING AND RELATED INDUSTRIES In case you missed it, Part 1 of this series looked at housing demand fundamentals and demographics and Part 2 examined housing affordability. Today in Part 3 I will introduce a new-to-me-at-least and improved measure of housing and related industries. Our office has routinely discussed housing related employment in the past few years,particularly as
OREGON WAGES, A 2017 UPDATE Oregon Wages, A 2017 Update. The labor market is tight, the share of prime working-age Oregonians with a job is back to mid-2000s rates across all levels of educational attainment. While this is certainly good news, the question our office is being asked more and more is about wage growth. We have a lot of jobs, but what about wages? GROWTH IN A SUPPLY-CONSTRAINED ECONOMY Economic growth is surging as the pandemic wanes. Thanks to federal fiscal policy, consumers have higher incomes today than before COVID-19 hit. Now they are increasingly allowed to and feel comfortable resuming pandemic-restricted activities like going out to eat, on vacations, getting haircuts and the like. The outlook for near-term economic growth is the strongest OREGON ECONOMIC AND REVENUE FORECAST, MAY 2021 This afternoon the Oregon Office of Economic Analysis released the latest quarterly economic and revenue forecast. For the full document, slides and forecast data please see our main website. Below is the forecast’s Executive Summary and a copy of our presentation slides. Economic growth is surging as the pandemic wanes. Thanks to federalfiscal policy,
MAY | 2021 | OREGON OFFICE OF ECONOMIC ANALYSIS Oregon Economic and Revenue Forecast, May 2021. Posted by: Josh Lehneron May 19, 2021.
SO FAR FEWER BUSINESS CLOSURES THAN EXPECTED Our office remains very concerned about business closures and permanent layoffs. The more of this economic scarring that accumulates before the recovery can truly get underway will weigh on the strength of that recovery. The pandemic has impacted all aspects of the economy to varying degrees. Small business in particular appear the mostvulnerable as
ZOOM TOWNS ARE REAL (GRAPH OF THE WEEK) Zoom Towns are Real (Graph of the Week) Stories about pandemic migration and working from home abound, even as we are months away from any hard data. This can be a struggle, balancing these anecdotes and speculation when we lack any real OLDER WORKERS AND RETIREMENTS Our office takes a bit of a more holistic view of retirement in Oregon — we count anyone 60 years and older who is out of the labor force for whatever reason, in part because the splitting the already small sample into the different possible answers yields some noisy results. Even so, we know retirements have been large in recent years. OREGON CONSTRUCTION OUTLOOK, DEC 2020 Oregon Construction Outlook, Dec 2020. Typically, construction is a more volatile sector than the overall economy. It falls further in recessions, but bounces back stronger in expansion. New residential construction historically has been a great leading indicator with it’s declines starting ahead of full-blown recessions, andrebounding
OREGON’S INCOME DISTRIBUTION Oregon's income gains this expansion are among the best in the nation, as our office has highlighted in recent years. The state's median household income now matches the U.S. for the first time since the mills started closing in the 1980s. The single largest factor underlying this growth is the strong labor market. For individuals OREGON’S OLDER POPULATION: A STATISTICAL PROFILE 795,635. Projected number of people 65 and older in 2020. Elderly will comprise 18.3 percent of the total population in 2020. Between 2009 and 2020, the elderly population will increase by 57 percent or 4.1 percent annually, on average. The pace of growth of the elderly population will be 4 times that of the overall population. COLUMBIA RIVER GORGE The next installment of the regional series takes a look at the Columbia Gorge and Mid-Columbia counties. This region has been the best performer, in both employment and unemployment terms, this business cycle and provides an interesting contrast with the previous post on Central Oregon, the worst regional performer this cycle. Inkeeping with the
OREGON OFFICE OF ECONOMIC ANALYSIS A complicating factor here is we do not actually know what underlying income growth is for the typical family today. Real-time national estimates for median household income dropped a little bit during the recession and have grown slowly in the past 6-9 months. I am using that income pattern underneath the numbers shown in the chart above for the affordability calculations. HOW FROTHY IS THE HOUSING MARKET? A one percent decline in rates offsets roughly a 13 percent increase in purchase price, while maintaining the same monthly mortgage payment. This means if a household was looking to buy a $400,000 home pre-pandemic, they could afford a $450,000 home during the pandemic. A $500,000 budget became a $565,000 budget, and so on. COVID-19: SMALL BUSINESS SURVIVAL AND PPP Recessions always change the economy. Even as jobs, income, and profits return and surpass the previous peak, the underlying structure of the economy is different than it was prior to the recession. In technical terms, something like GDP fails the unit root test even if activity and growth returns to it's long-run trend, at leastJOSH LEHNER
Josh develops the quarterly Oregon Economic forecast, including outlooks for employment, income and housing. Additional responsibilities include the Oregon Index of SO FAR FEWER BUSINESS CLOSURES THAN EXPECTED Our office remains very concerned about business closures and permanent layoffs. The more of this economic scarring that accumulates before the recovery can truly get underway will weigh on the strength of that recovery. The pandemic has impacted all aspects of the economy to varying degrees. Small business in particular appear the mostvulnerable as
CHECKING IN ON PORTLAND Checking in on Portland. Large urban economies have tended to suffer the most during the pandemic. Portland has been no exception. If we look at the latest employment data here in Oregon it shows that Multnomah County has the largest job losses in the state relative to pre-COVID peaks*. Much of the urban losses can be tied directly tothings
OREGON’S INCOME DISTRIBUTION Oregon's income gains this expansion are among the best in the nation, as our office has highlighted in recent years. The state's median household income now matches the U.S. for the first time since the mills started closing in the 1980s. The single largest factor underlying this growth is the strong labor market. For individuals OREGON, DIVERSITY AND THE MIDDLE EAST Oregon, Diversity and the Middle East. People have been moving to Oregon in droves ever since Lewis and Clark*. This fact is a foundational statement in our office’s presentations and one of the key reasons Oregon’s economy outperforms the typical state over the business cycle. As our office has pointed out in the past, Oregon is VEHICLE MILES TRAVELED, AGE EDITION Our office oversees the state's Highway Cost Allocation Study each biennium and one of the topics discussed, obviously, is the issue of vehicle miles traveled. Nationally VMT is effectively flat, while VMT per capita is down. In Oregon we've seen similar, yet more pronounced, trends. One contributor to this decline is the fact that younger HOUSING AND RELATED INDUSTRIES In case you missed it, Part 1 of this series looked at housing demand fundamentals and demographics and Part 2 examined housing affordability. Today in Part 3 I will introduce a new-to-me-at-least and improved measure of housing and related industries. Our office has routinely discussed housing related employment in the past few years,particularly as
GROWTH IN A SUPPLY-CONSTRAINED ECONOMY Economic growth is surging as the pandemic wanes. Thanks to federal fiscal policy, consumers have higher incomes today than before COVID-19 hit. Now they are increasingly allowed to and feel comfortable resuming pandemic-restricted activities like going out to eat, on vacations, getting haircuts and the like. The outlook for near-term economic growth is the strongest OREGON ECONOMIC AND REVENUE FORECAST, MAY 2021 This afternoon the Oregon Office of Economic Analysis released the latest quarterly economic and revenue forecast. For the full document, slides and forecast data please see our main website. Below is the forecast’s Executive Summary and a copy of our presentation slides. Economic growth is surging as the pandemic wanes. Thanks to federalfiscal policy,
HOUSING | OREGON OFFICE OF ECONOMIC ANALYSIS Oregon Economic and Revenue Forecast, March 2021. Posted by: Josh Lehner on February 24, 2021. OREGON REACHES A GRIM POPULATION MILESTONE Oregon Reaches a Grim Population Milestone. I hope the pandemic progress Graph of the Week cheered you up a bit heading into last weekend because I’m here to bring you back to earth with some new data. The Oregon Health Authority just updated the monthly vital statistics — births and deaths — through December. OREGON’S OLDER POPULATION: A STATISTICAL PROFILE 795,635. Projected number of people 65 and older in 2020. Elderly will comprise 18.3 percent of the total population in 2020. Between 2009 and 2020, the elderly population will increase by 57 percent or 4.1 percent annually, on average. The pace of growth of the elderly population will be 4 times that of the overall population. MARIJUANA DEMAND, SUPPLY AND SUBSTITUTION Notes on three new marijuana research pieces that has come out recently. First, 2017 state level estimates of drug and alcohol use were released this week. What it shows is a continuation of trends related to marijuana use in the past decade. States with legal recreational and medical marijuana generally see the highest usagerates
OREGON’S TIMBER HISTORY, AN UPDATE What follows is an industry recap and a new set of slides. In the 1970s when annual Oregon timber harvests totaled more than 8 billion board feet, the industry was a huge economic force. The sector directly employed 80,000 or so workers at wages some 30% above thestatewide average.
HOUSING AND RELATED INDUSTRIES In case you missed it, Part 1 of this series looked at housing demand fundamentals and demographics and Part 2 examined housing affordability. Today in Part 3 I will introduce a new-to-me-at-least and improved measure of housing and related industries. Our office has routinely discussed housing related employment in the past few years,particularly as
PART-TIME EMPLOYMENT A lot has been make of part-time vs full-time employment and with good reason. Hours worked were cut during the Great Recession and there have also been periodic claims that all the jobs being added recently are part-time, not to mention the potential impacts of the Affordable Care Act. In particular, the ACA does create EDUCATIONAL ATTAINMENT BY GENERATION, GRAPH OF THE WEEK Educational Attainment by Generation, Graph of the Week. It’s well documented that college graduates overall have better labor market outcomes than those without degrees. They participate in the labor force more, have a lower unemployment rate and earn higher wages. And in the context of job polarization, a college degree is the surestpath
OREGON OFFICE OF ECONOMIC ANALYSIS Oregon Economic News, Analysis and Outlook* About
* Regional
* Reports
Posted by: JOSH LEHNER | May 20, 2020 OREGON ECONOMIC AND REVENUE FORECAST, JUNE 2020 _This morning the Oregon Office of Economic Analysis released the latest quarterly economic and revenue forecast. For the full document, slides and forecast data __please see our main website__. Below is
the forecast’s Executive Summary._ While the Covid-19 outbreak has injected a great deal of uncertainty into the outlook, the nature of our forecast is unchanged. As always, the June 2020 economic and revenue forecast represents what the Office of Economic Analysis and its advisors believe is the most probable outcome given available information. Although actual economic growth and state revenues may depart significantly from these projections, we aim to build a forecast that is just as likely to end up too high asit is too low.
Forecast errors on both the high and low side create problems for decision makers. In a recessionary environment, a revenue forecast that is too low may lead to cuts in public programs that are unnecessarily deep. If the revenue forecast proves to be too optimistic, the budget will need to be rebalanced when the truth eventually comes out. Rebalancing becomes increasingly difficult as we approach the end of a budget period, given that much of the allocated resources have already been spent. In one sense, the sudden stop of economic activity due to the outbreak of Covid-19 has made the revenue outlook clearer. Economists have a particularly difficult time forecasting turning points in the business cycle. This time around, it became clear overnight that Oregon is in recession and that the downturn will be severe. Recovery will takeyears.
As social distancing restrictions continue to lift in the months ahead, underlying economic activity will return. Pent-up demand will transition the economy from recession to recovery as households are able to venture out to a larger degree. This rebound in consumer spending, business sales, and profits will lead to firms hiring back some employees. Economic growth in the second half of this year will be strong. However this initial bounce back will be far from complete. After this rebound in economic activity, growth will continue but at a relatively slow pace due to the uncertainty surrounding public health. Firms and households are expected to remain somewhat hesitant and only gradually test the waters. Once business and consumer confidence fully return following available medical treatment or the passing of the pandemic, stronger economic growth will resume and the economy willfully recover.
While this recession is extremely severe – the deepest on record in Oregon with data going back to 1939 – it is expected to be shorter in duration than the Great Recession. The economy should return to health by mid-decade. The reasons for the faster recovery include the fact that there were no major macroeconomic issues or imbalances prior to the virus, much of the initial severity of the recession is due to suppressed economic activity, and the federal policy response, however imperfect, has been swifter and more targeted than in recent cycles. Combined, these factors should help limit the amount of permanent damage done to the economy during the shutdown phase. Should the number of firms that close, or the number of workers displaced remain relatively limited, or rather the amount of time they spend as such be limited, then the overall economic recovery timeline should be shorterthan last decade.
How severe will the revenue slowdown be? During most business cycles, Oregon’s state revenues have proven to be more volatile than those in the typical state. Not only is Oregon’s underlying economy subject to boom-bust swings, but the state also depends on a very volatile mix of revenue instruments, led by personal and corporateincome taxes.
During the current recession, income taxes might not fare so poorly in comparison to other revenue instruments. Given the depth and breadth of the current economic downturn, no state revenue system will be spared from pain going forward. The need for isolation has led to spending declines that far outstrip what is usually seen during recessions, hitting sales tax states disproportionately hard. States that depend on tourism and energy/mining revenues are also in for atough year or two.
Oregon will share some of the pain felt by sales tax states since our revenue system has become much more dependent on consumer and business spending over time. Even before the corporate activity tax was enacted in 2019, a wide range of sales-based taxes had been expanded in recent years. Taxes on lodging, gasoline, vehicle purchases, video lottery and marijuana sales are all much more substantial than they were during the last recession. While some taxes will fare better than others, all major revenue sources will face considerable downward pressure given the severity of the recession. The sudden stop in economic activity has led to the largest downward revision to the quarterly forecast that our office has ever had to make. In the baseline (most likely) scenario, General Fund and other major revenues have been reduced relative to the March forecast by $2.7 billion in the current biennium and $4.4 billion in the 2021-23 budget period. Fortunately, Oregon is better positioned than ever before to weather a revenue downturn. Automatic deposits into the Rainy Day Fund and Education Stability Fund have added up over the decade-long economic expansion, and stood at $1.6 billion in April. In addition to dedicated reserve funds, the General Fund had over one billion dollars in projected balances before the recession hit. _See our __full website__ for all
the forecast details. Our presentation slides for the forecast release to the Legislature are below._Leave a Comment
Posted in Demographics,
Employment ,
Income ,
Miscellaneous
, News
, Revenue
| Tags: cat
, corporate activity tax,
covid19 , downturn
, Economic
, Economy
, estate
, Expansion
, Forecast
, general fund
, Lottery
, marijuana
, migration
, Oregon
, outlook
, Population
, Recession
, Recovery
, Revenue
, tax collections
, Taxes
, tobacco
, video lottery
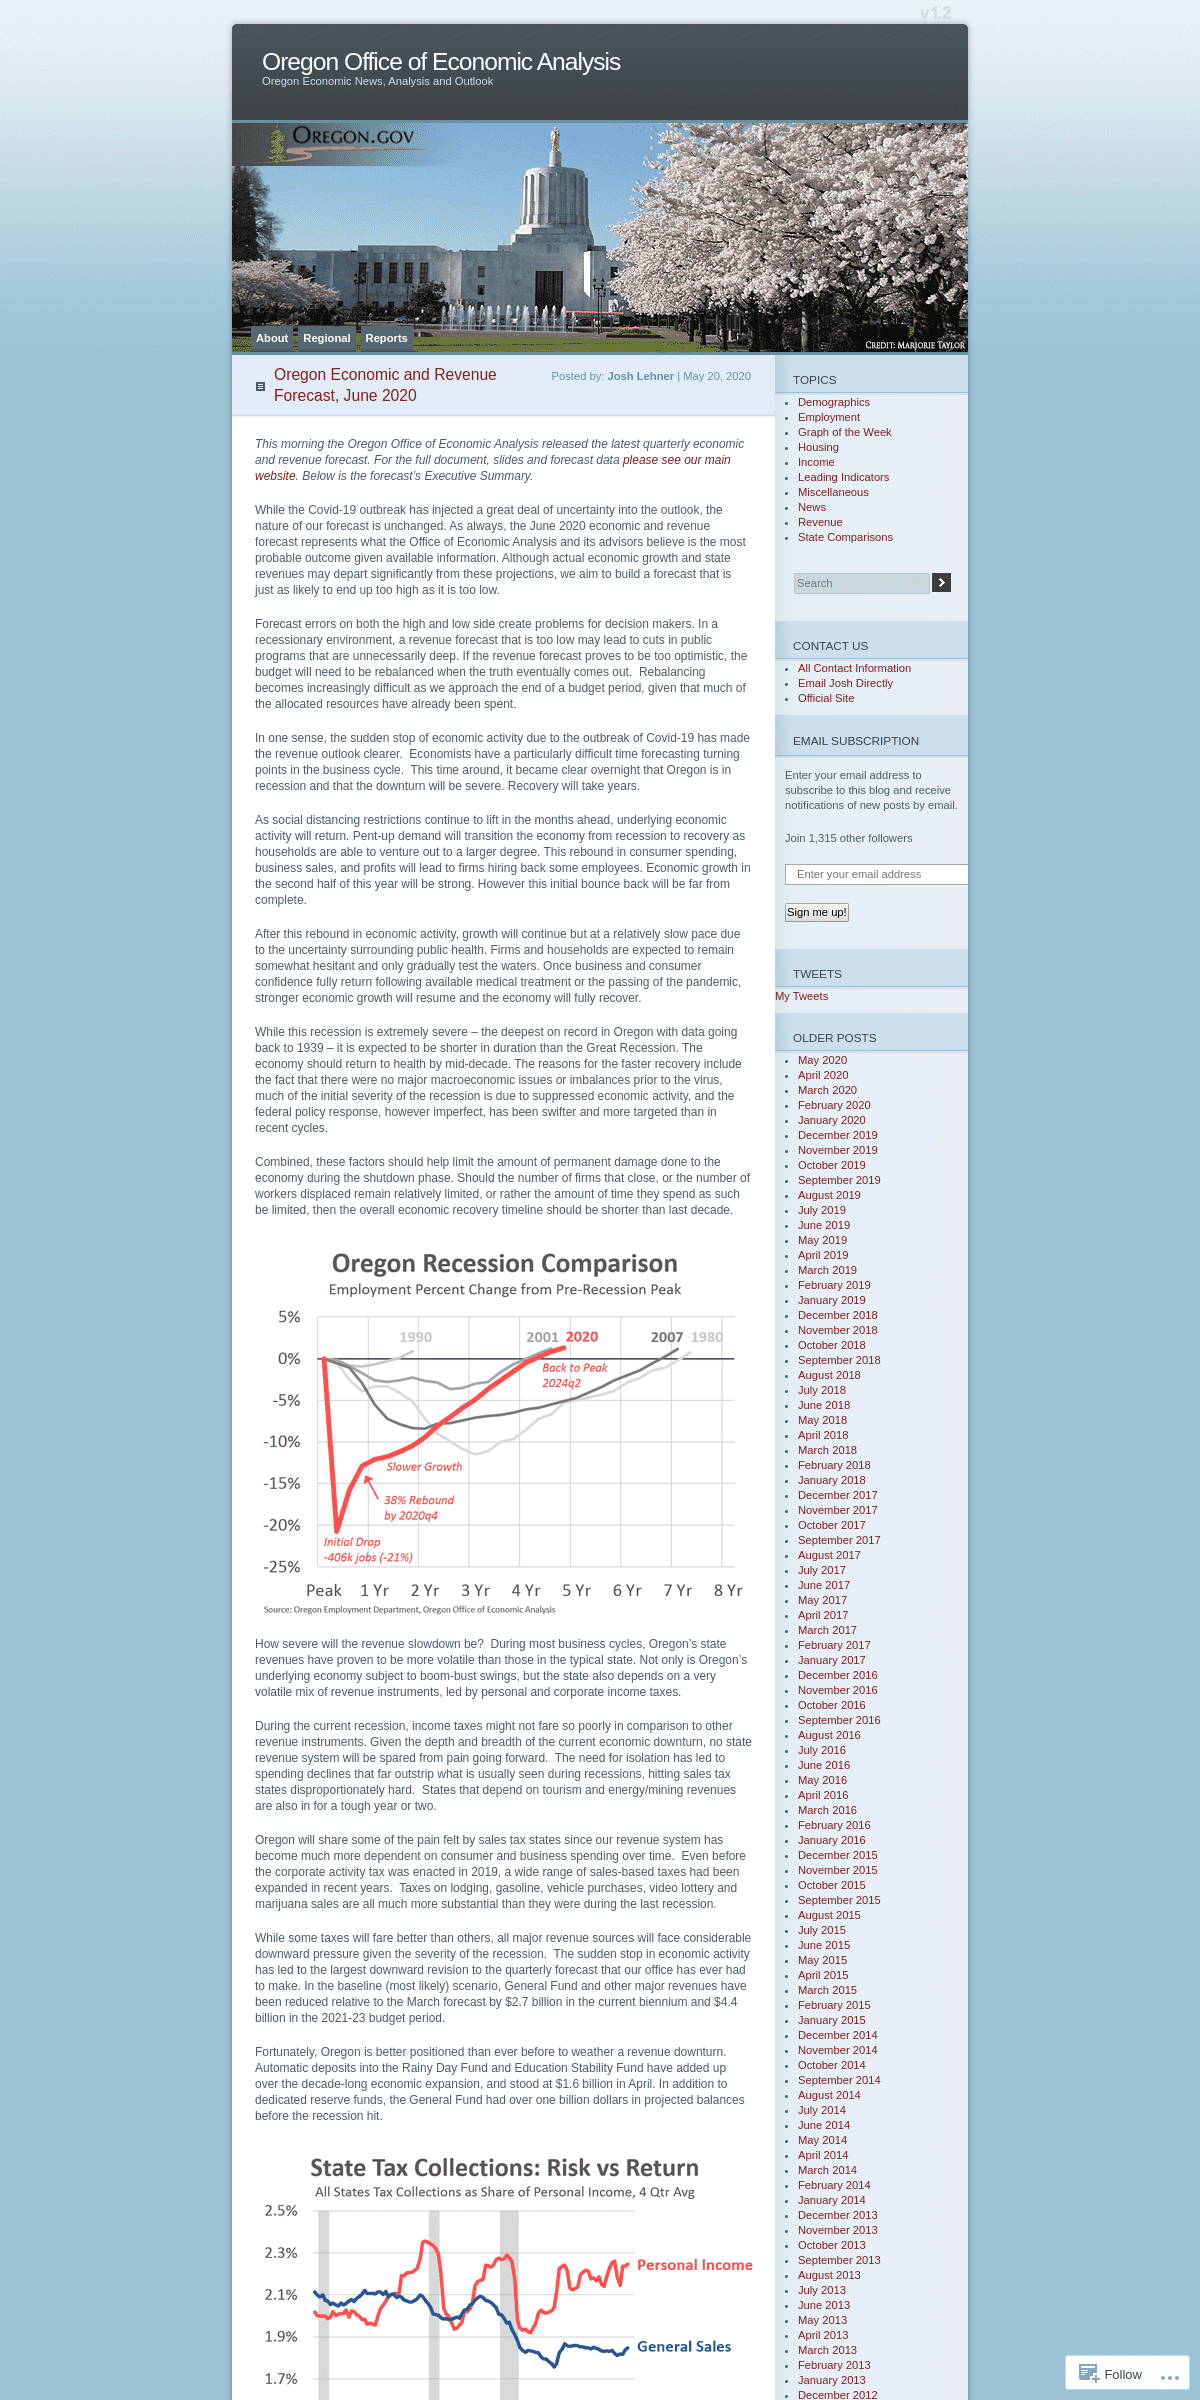
Posted by: JOSH LEHNER | May 19, 2020 RECESSIONS IN OREGON (GRAPH OF THE WEEK) This morning the April employment report for Oregon was released.
As expected it was catastrophic. Between the revisions to March and the preliminary data for April, Oregon has lost 267,000 jobs (-14%) in the past two months. The unemployment rate spiked to a record 14.2%. Already this is the deepest recession on record in Oregon, with datagoing back to 1939.
This depressing version of the Graph of the Week compares employment losses in Oregon for each of the past 5 recessions. Tomorrow our office will release the latest economic and revenue quarterly forecast. I have been making similar types of charts in recent weeks based on our forecast and let me tell you something, the official data just hits differently. This chart is even more striking than I expected. It’s not made up, it’s not a forecast, it’s real. As you can see, the current recession doesn’t look anything like past cycles. The sudden stop in the economy looks more like what happens to economic activity during a labor strike or in the aftermath of a natural disaster. However, unlike in those situations, our office does not expect activity to quickly return to pre-recession levels like it does when the labor strike is resolved or the rebuilding phase kicks in. Stay tuned tomorrow for more on the outlook.5 Comments
Posted in Employment, Graph of
the Week
,
Miscellaneous
, News
| Tags: 2020
, Comparison
, covid-19
, covid19
, Employment
, Job Loss
, Oregon
, Recession
Posted by: JOSH LEHNER | May 6, 2020 THE KIDS WERE FINALLY LEAVING THE BASEMENT… Oregon’s economy is more volatile than the U.S. for two primary reasons: our industrial structure and migration. Both of these are pro-cyclical meaning they decline or slow further in recessions but grow faster in expansions. Over the entire business cycle, Oregon grows faster than the typical state. A few weeks ago I was originally supposed to be part of a real estate event that was understandably canceled. What follows is some of the research I had been doing that presentation in recent months that touches on young adults, recessions, migration patterns, housing demand and the like. One socio-economic trend that emerged from the Great Recession was the big increase in young adults living at home. With few job opportunities available they had no choice. Many enrolled in higher education as well. Then once the labor market heated up by the mid-2010s, they were able to find jobs at higher rates, but housing costs were skyrocketing due to the lack of supply. The result was that for the better part of a decade, the share of young adults living at home remained stubbornly high. However, that was finally starting to change in the past year. It took a lot longer than I expected, but it was happening. The combination of a strong labor market delivering better income gains, plus the increase in new apartment construction beginning to hold down rents meant that young adults could better afford to live on their ownagain.
Now all of this is up in the air, or rather locked in place I suppose. It’s hard to know exactly how the 2020 recession will impact these trends moving forward. A large part of it will be the duration of the recession and recovery. We know it is very severe at the moment, but that longer trajectory of recovery will be the key factor at play. Complicating the picture are all the things John Tapogna, President of ECONorthwest, mentioned on Willamette Week’s _Distant Voices_ series the other day. John touched on slower migration, household’s incomes are down and their ability to pay is worse in a recession, households may double up to save money, and the like. All of this puts downward pressure on prices in the near term, at least until the trends reverse once the expansion picks up. The key here for the medium and long-run outlook is the slowdown in migration. Our office is still working on updating our forecast, but in the past year or two I had already been doing some rough recession modeling and its impact on migration and household formation, at leastfor Eugene
and Portland
.
What follows is a rift off of that work. Right now, given the shelter in place style policies all around the country, nobody is moving. This is happening during the spring listing season. Should these policies remain in place — either officially or enforced via social norms — through the entire summer moving months, then migration for 2020 will likely be the smallest we have seen since Oregon lost population during the early 1980s. Even so, we know migration slows in recessions. Oregon will see fewer people move here this year and next than we thought prior to the recession. This will have knock-on effects in terms of labor supply in the years ahead and lower levels of consumer demand for restaurants, housing and the like. Some rough projections indicate that we may lose the equivalent of 1-2 years of population growth as a result of the recession, not all of which will be made up when the expansion hits full swing further down the line. _Note: Our office will have an updated population forecast in two weeks, these figures are back of the envelope work I had been doing. Also the chart below includes ALL 20-34 year olds in the Portland region, it is labeled apartment demographics given the vast majority of people in this age range are renters._ Finally, I updated our look at migration patterns across the country among young college grads. See our office’s previous report and state comparison for more background. This topic is extremely important when it comes to future economic growth. Oregon’s ability to attract and retain young, working-age households is a huge economic advantage. Coming out the other side of this, following migration patterns will be a key thing to watch. That said, given how much the world has changed in recent weeks, I won’t dig into the details here given we are dealing with dated data. I will just note two things. Among large metros across the country, Portland remained a top migration destination for young college graduates. This goes for all types of graduates including those with scientific, technical, or medical degrees. In fact, migration has been a bit stronger in Portland in recent years among this latter group. This continues to be good news when it comes to the technical skills of Oregon’s workforce, and for those with such concerns, however overblown theymay be.
On the other hand, Portland’s relative position has fallen somewhat in recent years. No longer were migration patterns to Portland significantly outpacing the rest of the country, they were merely leading the pack in the latest Census data. This is still an enviable position. It still indicates stronger long-run growth. But it is certainly worth monitoring moving forward largely because people move for two primary reasons: jobs and housing. If workers cannot find a suitable job opportunity nor afford to move here, then longer-run growth would be lowered as a result. BOTTOM LINE: In the very near term, shelter in place style policies mean hardly any migration. This goes for both long distance moves into or out of the region but also moving, buying, or selling withing the state as well. Over the medium term, migration slows in recessions but then picks up in expansions. Household formation rates and housing demand follow suit. Over the long run, our office believes Oregon’s ability to attract and retain households in their root-setting years will remain intact, until proven otherwise. The keys to watch will be job opportunities and housing availability and affordability, all of which will show up in these migration patterns of 20- and 30-somethings in the years ahead.1 Comment
Posted in Demographics,
Employment ,
Housing ,
Miscellaneous
, News
| Tags: apartment
demographics
,
college graduates
, covid19
, demand
, household formation, Housing
, kids in the
basement
, living
at home ,
living on own ,
migration , Oregon
, young adults
, young college
graduates
Posted by: JOSH LEHNER | May 1, 2020 COVID-19: INDUSTRY IMPACTS The Oregon Employment Department has been doing a good job every week publishing the latest data andproviding insights
into who is applying for unemployment insurance. As seen in the chart below, the first wave of initial claims from the COVID-19 recession is thankfully dissipating. However the level of claims remains significantly high by historical standards and the cumulative totals are staggering. In the past 6 weeks, Oregon has seen nearly 340,000 more initial claims than would have been expected in a strong economy. We’ve also been able to learn a great deal about who is filing these claims in terms of their age, industry, occupation, educational attainment, county and the like. As I’ll get to in a minute, this has been quite helpful in terms of helping our office think through this initial shock to the economy. But before we get to that I would recommend reading OED’s Damon Runberg’s, insightful look at thesecharacteristics
,
or watch the tag team presentation Damon and I did last week. Additionally I just wanted to add another lens to look at the data: the ability to work from home. The next chart combines three things. First, the occupation of Oregonians filing initial claims (y-axis). Second, new research from economists out of the University of Chicago on the potential of working from home by occupation based upon the tasks they perform and how much interaction they need to have with clients or customers (x-axis). Third, job polarization research and the breakdown between low-, middle-, and high-wage occupations (colorof bubbles).
As expected you see that lower wage occupation in food preparation and personal care lack the ability to work from home and have seen the largest share of the workforce file for claims. These jobs require performing duties at specific locations for customers coming through the door. Conversely, high-wage jobs can largely be done from home provided there is an internet connection and have seen the smallest share of such workers file initial claims. Middle-wage jobs are a mixed bag on both fronts. Overall the University of Chicago work indicates that about 1 in 3 workers in Oregon have the ability to work from home, at least theoretically. As seen in the Venn diagramyesterday
,
this 1 in 3 goes for both workers with or without kids. Finally, we know that our traditional economic data lags by a month and usually more. The first substantial impacts of social distancing on the labor market will show up in the April employment report. For Oregon that report will be released on May 19th, the day before our office’s forecast release on May 20th. In other words it comes too late this cycle to be of any real assistance. We are building the plane as we fly. The characteristics and nature of the initial claims have been quite helpful in clarifying our office’s thinking as we develop the outlook. I won’t get into hard numbers today — that’s what our actual forecast is for — but I wanted to provide an update on the industry impacts of COVID-19 and our office’s thinking. The table shows the various sectors of the economy and how one may group them based on the severity of the recession. The first column is based on some of the initial thinking about the nature of social distancing a month or so ago. Retail plus leisure and hospitality would take the biggest hits, plus their transportation networks and supply chains. The second column is stepping back today, looking at the data so far and our beliefs about the trajectory of the cycle. A few things stand out. Even as these categories are graded on a scale and the importance is the _relative_ distinction across sectors, the severity of the recession is worse than many forecasters expected even a few weeks ago. It seems like most national forecasters are still trying to catch up to the reality on the ground. Every update they provide to their outlook is a bit worse than the previous iteration. Time will tell just how severe this initial drop is, and how strong of a rebound we get from pent-up demand once the health situation improves further and social distancing policies begin to lift. But what I want to focus is the simple fact that the impacts are not contained to just bars, restaurants, nail salons, and the like. Yes, that may have been the tip of the spear. However we are seeing the impacts bleed throughout the entire economy. No sector is left unscathed. This was our office’s biggest concern about the initial line of thinking that emerged. Even today you can still find newly released reports trying to gauge the number of workers at risk due to social distancing policies. We’re more than a month past that stage. That research is no longer helpful. The simple reason why is that the demand shock has been so large that it impacts everything. Update: A few people have asked about the Government being classified as mild. This is certainly the case right now. Our office is building in declines in the coming fiscal year, some of which are persistent over the entire forecast horizon. It’s not that the public sector won’t be impacted, it’s a matter of degree. The overall recession is severe, but right now the outlook for public sector employment is abit less than that.
In terms of the outlook, not every sector will follow the same path. Our office is still thinking along the lines of a square root recoveryoverall
,
but there are underlying differences. Oh by the way, Fed Chair Powell is thinking along the same lines as seen in his press conference thisweek
(see his remarks at 24:00 in the video, or pg 12 of the transcript). The rebound in economic activity in the months ahead will likely be concentrated among the consumer service sectors. This includes leisure and hospitality, retail, other services, plus other industries like health care as elective surgeries come back, financial activities as the real estate market picks back up some, and the like. What likely won’t show the same patterns would be our goods producing industries, which have taken a hit. One reason is the demand shock is still being felt. It takes time for some chain reactions to occur. A loss of income today turns into reducing spending today, yes, but also in the months ahead. In particular, sales of big ticket durable goods — appliances, cars, homes, etc — are very volatile over the business cycle as firms and households can delay such purchases until their income or confidence returns. So even as consumer services will return to growth later this year, it may be reasonable to expect goods producing industries will see losses throughout 2020 before returning to growth a few quarters down the line. At least provided overall economic activity continues to pick up, propping up demand. If we look further out to the mid- or late-2020s, what changes can we expect to see? That’s a bit harder to answer, obviously, or rather the forecasts have a lot larger error bands around them. We are likely to see some structural losses among our goods producers, retail and so forth. Some of these industries were already on edge and while turning off the lights on the economy is easy, restarting it is not as simple as flipping the switch back on. Furthermore, I am skeptical that we, as a society, will be going out to eat significantly less in 2025 than we were in 2019, provided the public health situation is under control. As such, it is quite possible that the sectors most impacted by social distancing will return to their old trajectories, or close to it, while it may be these other sectors that bear the brunt of the long-run permanent damage. _In terms of process, our office is nearing completion of the economic outlook and ramping up our focus on translating that into state revenues in the weeks ahead. Stay tuned for our latest thinking ahead of the forecast release on May 20th._1 Comment
Posted in Demographics,
Employment ,
Miscellaneous
, News
| Tags:
Construction ,
covid-19 , covid19
, decline
, education
, Employment
, financial
activities
,
Forecast , goods
producing ,
Government ,
Growth , health care, industries
, industry
, information
, initial claims
, leisure &
hospitality
, Logging
, Losses
, manufacturing
, natural
resources ,
Oregon , other
services ,
outlook ,
polarization ,
Recession , retail
, sector
, sectors
, square root
recovery
,
wholesale , work
from home
Posted by: JOSH LEHNER | April 30, 2020 COVID-19: FORCED SAVINGS AND DECLINING PRODUCTIVITY This morning I have a round-up of the latest economic data and our office’s thinking on the outlook. First, let’s talk about near-term sources of economic growth. I think most people have a good intuition on this, but our office is working to articulate it better as we develop the upcoming forecast. Much of the initial rebound in growth our office is expecting later this year is due to pent-up demand. The primary driver here is the forced savings we are seeing today. Households — particularly higher-income households — simply cannot spend as much money as they would like, or at least as much as they normally do. Stores and restaurants are shut down, or offer limited services. Even in this time of financial turmoil and stress for millions of workers, the savings rate is skyrocketing overall. To this point, this morning’sdata release
shows that U.S. incomes dropped 2% in March but spending declined 7.5%. Savings increased considerably. As the health situation continues to improve, and social distancing restrictions begin to lift, some of this forced savings will be unleashed in the form of pent-up demand. Households will go to stores and out to eat more. Businesses will need to restock inventories, producing positive knock-on effects across the supply chain and the like. However this recovery will be incomplete for two reasons. One is that even as restrictions begin to lift, the threat of the virus remains real. Society will not return to normal. Consumers will remain hesitant, at least until there is a widely available medical treatment. The second reason for an incomplete recovery overall is the amount of permanent damage in the economy. Spending will eventually revert not to the previous level of spending, but to current income (or current permanent income). So as the economic damage mounts, and jobs and incomes remain lower, then the path of consumer spending will also remain lower than believed before the virus hit. This week also brought our first look at GDP in the first quarter of 2020. As expected, it was ugly. GDP contracted nearly 5% last quarter, on an annualized basis. However we know that January and February were pretty good months and that social distancing really only went into effect in March. So to get such a large decline for the quarter overall, that means the drop in economic activity in March was massive. The full impact will show up in the second quarter data and will set all sorts of bad economic records. That said, as noted above, we do expect pent-up demand to drive growth in the second half of the year. Now, one item that stood out in the details of the GDP report was the decline in productivity. Economist Ernie Tedeschi postedthe
following chart on Twitter the other day. Now, productivity declines are bad for economic growth and living standards, particularly over the long run. That said, I wouldn’t harp too much on it today given the circumstances we find ourselves in, even if it remains an issue to watch in the coming quarters. What the decline in productivity really made me think of is how working from home and schools being closed impact our daily lives. This is something I touched on last week during the presentation for the Bend Chamber of Commerce.
The following Venn diagram below is an updated and simplified version of one shown here on the site previously. While social distancing impacts us, it does vary based upon our life circumstances like our line of work, our family situation, and the like. We are all trying to figure this out as we go. _Stay tuned. Tomorrow I will have an update on our office’s thinking of the industry impacts of COVID-19._4 Comments
Posted in Demographics,
Employment ,
Income ,
Miscellaneous
, News
| Tags: covid-19
, covid19
, forced savings
, GDP
, kids
, Oregon
, pent-up demand
, permanent
damage ,
productivity ,
savings , schools
, spending
, working from home
Posted by: JOSH LEHNER | April 27, 2020 VIDEO: COVID-19’S IMPACT ON OREGON’S ECONOMY _Our office has fielded a lot of requests in recent weeks for our thoughts on the economic outlook and what it means for the state budget. After all, that is our job. We have been happy to discuss some things in the big picture perspective, just like we do here on the blog. However we have not publicly discussed any specifics regarding the outlook nor how it translates into state revenues and impacts the budget. These types of requests we have pushed off until after May 20th when we will release the next economic and revenue forecast. This is in part because the forecast is still being developed. Our office has not finalized anything yet and are meeting with our advisors again this week and next. Once we do finalize the outlook, we first let policymakers know and then discuss and upload the details behind it._
With all of that said, last Friday, I had the opportunity to tag team a presentation with Damon Runberg, regional economist for the Oregon Employment Department, for the Bend Chamber of Commerce. Damon has been digging into the characteristics of those filing for unemployment insurance in recent weeks — read his latest article,
download the data
,
or watch his presentation below. I followed his presentation with some thoughts on the nature of the economic shock, the likely shape of the recovery, how federal policies are trying to keep household and firms’ heads above water, and just a couple thoughts on state revenues and the size of current budgetary reserves. A quick recap and timeline of the video is as follows. Katy Brooks, the Bend Chamber’s CEO starts off with some introductory comments, Damon’s presentation starts at the 4:14 mark and goes through until I come in at 22:28. I go until just past the 39 minute mark, after which time Katy moderates a Q&A portion for the last 20 minutes. I’m biased, but I thought overall it was a good discussion with lots of information on the current state of the economy, including lots of details on the new unemployment insurance programs and rules, plus some broader thoughts on the outlook. I’d like to thank the Bend Chamber and Damon for inviting me. Click here to download a copy of my slides: Bend Chamber Lehner Wide042420
4 Comments
Posted in Employment Posted by: JOSH LEHNER | April 20, 2020 COVID-19: STAYING HOME AND DRIVING LESS Our friends over at the Oregon Department of Transportation have been busy. They are crunching numbers and writing reports on how COVID-19 is impacting traffic patterns, driving behavior, associated tax revenues, and the like. What follows is a quick summary of their latest reports and links to follow along as they publish updates. First, a new report, written by Becky Knudson, tracks traffic volumes at 38 points along the state’s highway corridors. This includes spots along I-5, I-84, I-205, I-405, US-97, US-197, US-20, US-26, US-30, US-395, OR-18, OR-22 and US-101. As you might expect, traffic is down considerably in recent weeks. Looking at all the data, Oregonians are driving 40% less than a year ago. What I found interesting after digging into the numbers is that these declines are basically uniform across the entire state. Driving is down significantly everywhere. You can find weekly COVID-19 trafficreports here
.
These declines in driving behavior basically translate one for one into reduced sales for motor fuels and gas taxes, which brings us to report number two, the latest ODOT transportation revenue forecast,
developed by Dan Porter and Sata Torosyan. As forecasters, our office feels for Dan and Sata who did much of the development and building of the forecast in late February and early March, or right as COVID-19 really began escalating here in the U.S. As such there was no real data on the impacts of the virus, and macroeconomic forecasters more generally had yet to come to grips with the situation either. That said, they were able to build in some preliminary impacts, including the 40% reduction in driving and forecasting a drop in new vehicle sales. To their credit they also committed to updating the outlook in a few months once the hard data starts to roll in, you can find thatupdate here
when
it is available.
While they may have found themselves in no man’s land in terms of the timing of the forecast, they did a great job in the report walking you through the potential impacts of COVID-19 on the various ODOT revenue sources, from gas taxes to DMV transactions to weight-mile and so forth. I want to highlight the report’s summary of trucking activity, as it clearly lays out what we have gone through in recent weeks but also where we are headed: > Initially we expect an increase in activity as households build > inventories, which increase freight traffic to grocery stores and > distribution centers. Also, there is some substitution between > restaurants and grocery stores and between box retail and online > retail. However, the substitution effect is likely not perfect, and > after this initial stock piling is exhausted, coupled with more and > more people losing their jobs, consumer spending will decline and > overall trucking activity will follow. I think the stockpiling/pandemic shopping/inventory building portion is well understood. We all have done it ourselves. However it’s the last part that I’m not sure is fully incorporated into the conventional wisdom yet. The demand shock is still reverberating and economic activity is falling. Yes, some of the spending declines are mandated. High-income households in particular are experiencing forced savings today — they cannot spend as much as they would like. However, spending will continue to fall, or at least be weak due to the recession and job and income losses. Even grocery store sales today have come back down to earth as the stockpiling portion is over. Additionally, the forecast mentions that low oil prices will support a faster rebound in motor fuel sales, everything else being equal, when social distancing restrictions begin to lift. This is particularly timely today given the current low prices and oil futures that are even trading at _negative_ prices! Finally, along with reduced traffic volumes, we do see things like increased driving speeds, less congestion, fewer car crashes and the like. The table below shows that driving speeds in the Portland region are at or near posted speed limits today, even during rush hour. The following graph shows the steep drop in car crashes this year (dark blue) compared with last year (light blue). As an aside: our advisors mentioned that these are the outcomes you would expect when demand is restricted, although today demand is forced lower via a pandemic and social distancing, whereas normally this discussion surrounds tolls and getting the prices and incentives properly aligned, but I digress. Note that the last chart on crashes comes from a different set of new, weekly reports from ODOT that includes lots of detailed information on volumes, crashes, travel times and the like across different segments of the Portland region’s highway system (I-5 northbound, OR-217, etc). For example travel times are down 50-60% at the Wilsonville reader board. All told, these new reports from ODOT confirm what we would expect. Social distancing measures are designed to suppress the spread of the virus. They only work insofar as Oregonians follow both the spirit and letter of the policies. Thanks to the good work ODOT is doing reporting their data, it does look like Oregonians are holding up their end of the bargain to date.1 Comment
Posted in Miscellaneous, News
| Tags: congestion
, covid-19
, department of
transportation
,
odot , Oregon
, portland
, rush hour
, traffic
, volume
Posted by: JOSH LEHNER | April 15, 2020 COVID-19: SMALL BUSINESS SURVIVAL AND PPP Recessions always change the economy. Even as jobs, income, and profits return and surpass the previous peak, the underlying structure of the economy is different than it was prior to the recession. In technical terms, something like GDP fails the unit root test even if activity and growth returns to it’s long-run trend, at least gaugedby the naked eye.
Today, one big concern about the economy is the amount of permanent damage done during the social distancing and shutdown phase. We have already seen the leading edge of the impact in the data and it indicates severe labor force displacements. Hundreds of thousands of Oregonians have applied for unemployment insurance in just the past few weeks. Getting all of these Oregonians back to work will be a challenge once the public health crisis subsides, even under the best assumptions. It will be even harder to do if there are no firms tohire them back.
Running a business is extremely difficult. Roughly speaking about 1 in 5 new companies fail within their first year, while only around half make it to their fifth anniversary. When we layer on the impacts and drop in revenues today, we are seeing many more firms stretched financially, and likely an increase in firm closures in the months ahead. (Given start-up activity was already at or near historic lows, it will take time before new businesses are created to meet business and consumer demand.) This is why increased loans and grants to businesses were a big part of the recently passed Coronavirus Aid, Relief, and Economic Security (CARES) Act. Below we look at some recent research and insights on small businesses and the first available data on the initial round of Paycheck Protection Program (PPP) lending for small businesses. First, while most businesses are profitable or at least solvent, they do rely on cashflow to operate. A sudden stop in revenue impacts financials differently than the typical recession would, or at least the challenges and problems arise overnight and realigning expenses with revenues must occur just as quick. A new survey and paper byBartik et al (2020)
find that while the vast majority of small businesses have savings and cash available, it will only tide them over for a month, maybe two (see chart). Few firms can survive without revenue for longer than that. A recent Brewers Association survey of craft breweries found a nearly identical pattern among their members. So what can businesses do today to stay afloat? The chart below shows the different approaches and actions small businesses would take, according to a survey from the Federal Reserve.
I’m not sure if it is encouraging or discouraging that about 1 in 6 small businesses say they would need to close or sell the business if they experienced two months of revenue loss. Either way it is clear that a lot of firms cannot survive a sustained reduction in revenues,understandably so.
What is encouraging are the new business lending programs included in the CARES act. Probably the most prominent being the Paycheck Protection Payment (PPP) administered by the Small Business Administration which provides about $350 billion in forgivable loans to small businesses. UPDATE 4/17: The SBA announced that as of Wednesday night the PPP is fully accounted for. Small businesses will need more support. As the police chief said in _Jaws_ “you’re going to need a bigger boat.” The rest of the post is updated and edited, plus the chart is now includes the final data. The PPP was administered on a first come, first serve basis. Overall nearly 1.7 million loans were approved, totally $343 million. Here in Oregon nearly 19,000 businesses were approved in time before the funding ran out – hopefully more is coming — with Oregon firms receiving a total of $3.8 billion. This means small businesses in Oregon accounted for 1.1% of all PPP loans nationwide. This is somewhat low, but broadly in line with Oregon’s share of U.S. small businesses (1.6%) and small business payroll (1.3%). Looking across all states you can see how PPP loans largely match the patterns of small businesses themselves. That said, a majority of states are seeing somewhat larger shares, which are primarily coming at the expense of relatively lower volumes to California and New York, and somewhat lower to New Jersey and Washington. It’s interesting to note that these states are either the hardest hit by COVID-19 or experienced the impact and spread of the virus first. On twitter, economist Ernie Tedeschi had a few thoughts on why this may be. Finally, to help put Oregon’s 18,700 PPP loans for $3.8 billion in some sort of perspective, the rough math shakes out as following. About 1 in 5 small businesses in Oregon have been approved for a PPP loan. These loans are designed for 75% of the loan amounts to cover payroll over an 8 week period. This means the $3.8 billion will fill a 30-40% hit to small business payrolls in Oregon over two months. Given some of the initial claims data and speculation on the level of job loss and unemployment increases, these numbers are at least in the same ballpark in the big picture. The open question is whether the individual firms and dollar amounts of the approved loans are lined up those who need it most, and whether PPP will truly tide thesecompanies over.
All of that said, I think these initial findings represent good news. At least at first blush, the size of the CARES act appears to mostly fill the initial hole due to COVID-19. This also includes the household recovery rebates — being deposited now — which are a 1, maybe 2 month band aid for most Oregonians. Now, it doesn’t mean everyone or every firm will be made whole. There are a lot of things that fell through the cracks that policymakers are currently working on fixing. And of course the concerns lie with the duration of the public health crisis, the shape and strength of the subsequentrecovery
,
and the ongoing need for financial assistance to struggling firms and households. But for now, the public policy response has been an encouraging first step. Time will tell whether it came fast enough to truly help small businesses.1 Comment
Posted in Miscellaneous, News
, State Comparisons
|
Tags: cash , coronavirus, covid-19
, covid19
, failure
, grants
, lending
, loans
, Oregon
, payroll
, reserves
, small business
, solvent
Posted by: JOSH LEHNER | April 7, 2020 COVID-19: THE SQUARE ROOT RECOVERY? Our office is working on developing the latest state economic and revenue outlook. While much uncertainty remains, the broad contours of the recession and recovery may be coming into focus. While our officeprevious discussed
the underlying conditions that could lead to the classic V or U-shaped recovery, today we’re introducing the possibility of a new path: the square root recovery. The reason will hopefully be self-evident in minute. I wish I could claim the name, but Mark’s the one who coined it the other day in our discussions. The nature of this outlook is beginning to gain some traction among forecasters and among our advisors. The thinking is as follows. The sudden stop of the economy sends us into a severe recession overnight. Once the health situation improves some, the curve flattens and caseloads peak, the restrictions begin to be lifted. This results in some initial bounce back in economic activity, although far from 100%. We may be able to got out to eat, or get a haircut again, or the like. These firms will staff back up to meet this demand, but is the rebound 1/3 of the losses? 1/2 the losses? We don’t know that answer today. Plus some interest rate sensitive industries like construction or durable goods may come back once households are able to go out and resume some activities, particularly among the higher-income households who are building savings today. This initial bounce back likely takes the economy from near-depression level readings up to something resembling a severe or bad recession. From there the economy sees slow or moderate rates of growth until the health situation is under control. This may be due to the wide availability of a vaccine, herd immunity or some other treatment (antibody, etc) or development. Remember we are economists trying to translate the public health crisis into an economic forecast. For those familiar with the concept, this time period is the dance part of Tomas Pueyo’s The Hammer and the Dance.
After we have control over the public health side of things, then the economic recovery may exhibit more of the classic U or V shapes depending upon a variety of factors, including how much permanent damage is done during the recession — number of firms that fail, displaced labor, demand destruction, etc — plus consumer’s pent-up demand, monetary and fiscal policies, and the like. Visually, the nature of the recession and recovery resembles the square root symbol. Even if the contours of recovery may be coming into focus, there are considerable ranges of outcomes at all of these key points. Just how severe is the initial drop? When do health restrictions begin to life, when does the bounce back start? How strong will that be? Is it possible that even as consumer services rebound some, losses in other sectors offset those gains? How long until the health situation really is under control? How much permanent damage have we done to the economy in the meantime? In the weeks ahead our office is asking our advisors to help us map out these possibilities to produce our next forecast for policymakers. Finally, just to be clear, none of this is designed to be pitting the economy against public health. Research shows they are clearly connected and in past episodes, the economy is stronger in places that improve public health the most. As Bill Conerly said the other week, if you tell me the health outcomes, I can tell you the path of the economy. That remains true today. Two economic recommendations: Tim Duy’s latest in Bloomberg where he discusses how depth, duration, and deflation are the likely markers of a depression versus a recession. Tim also highlights how the permanent damage to the economy, and lack of a vaccine or cure for the virus are clear barriers to that initial bounce back being 100%. A new NBER paper by Guerrieri et al (2020) looks at how a pandemic supply shock can cause demand recessions. For those not interested in an academic paper, I recommend seeing this Tweetstorm by MIT’s IvanWerning ,
one of the coauthors.13 Comments
Posted in Employment, Income
, Miscellaneous
, News
, Revenue
| Tags:
business cycle
, coronavirus
, covid-19
, covid19
, depression
, Expansion
, Growth
, outlook
, Recession
, Recovery
, square root
, square root
recovery
, square
root shape
, u
, u-shape
, v
, v-shape
Posted by: JOSH LEHNER | April 3, 2020 COVID-19: INITIAL CLAIMS, SECTORS, AND UNEMPLOYMENT The bad economic data is just now starting to roll in, helping to quantify some of the initial impacts of the coronavirus. Yesterday we got another round of initial claims for unemployment insurance from last week at both the U.S. and state level. This morning we got the March employment report for the nation. Neither are good, which is to be expected, but we also know these are just the tip of the iceberg of what’s the come in the months ahead as the data catches up to the reality of what’s happening. First, initial claims last week set new records at the national and state level. The Oregon Employment Department reported that they received 92,700 initial claims last week. That breaks the previous record of 76,500 set the week before, which was basically triple the previous record set during the Great Recession. To be honest, it is hard visually to show these increases and to pay justice to the fact we’ve set records two weeks in a row. That fact gets lost in the charts. So I have switched from showing the _weekly_ claims and below I show _monthly_ initial claims. Obviously the point still stands, and thankfully the calendar aligns perfectly for looking at weekly data for March 2020. Now, we don’t yet have detailed information for all of these initial claims. Right now OED is able to provide sector and country breakdowns for the roughly 77,000 claims fully processed so far in March. See here for that detailed information including some nice Tableau visuals (good work Will BTW). I especially like the sector tree maps which are such an improvement over hideous pie charts. Now, I’ve repurposed the data a bit in the table below to try and show the relative sizes and increases across sectors. Tables have no visual impact, which is why I’ve color coded it some, but they do serve an important purpose in terms of being a reference. The table focuses on the 74,000 private sector claims for which detailed data isavailable.
Claims are up significantly across all sectors. That said, as expected the biggest increases are seen in leisure and hospitality with bars and restaurants nearly shutdown. Other sectors impacted to a larger degree include retail, and other services which includes gyms, salons, social organizations and the like. Health care is also seeing large increases which at least anecdotally is tied to childcare services in addition to reductions in elective surgeries, dentist offices and so forth. The final column is a bit of a goofy concept but it takes a location quotient style calculation to try and adjust for typical industry churn, or level of UI claims compared to its industry size and how those have changed today relative to recent years. Larger numbers and darker reds are bad. The second big piece of economic data we received this morning was the national employment report for March. Simply put, March was one of the worst economic months on record. Payroll jobs fell 701,000 and the unemployment rate spiked 0.9 percentage points, rising from 3.5 to 4.4 percent. To be honest these figures were a lot larger than I expected for March. The reason is due to timing. Data collected is focused on the pay period that includes the 12th of the month. The thought was early/mid-March was too early to really capture the impacts of COVID-19 which really hit later in the month. But even with the bad March numbers, we know April will be even worse. We get the Oregon March report on Tuesday, April 14, and the April report on Tuesday,May 19th.
Finally, I want to touch on a technical data issue. I have been fielding a lot of questions about how high Oregon’s unemployment rate will increase. I don’t have any specifics to offer right now, other than to note we are working on our next forecast. Of course the answer is probably a lot, but there is actually considerable amounts of gray area. It really comes down to how Americans and Oregonians answer the survey questions. How do they categorize themselves during this bizarre time where you aren’t at work but probably have a job to come back to whether you’ve been laid off or not, and how then how do BLS workers code the answers? The main possibilities can be seen in the flow chart below. Impacted workers will move from the dark blue “Yes” box to the light blue or red boxes, depending upon how they classify themselves. Do they still have a job, but are not at work? Are they out of work and still looking for a job? Or are they out of work and not actively searching because the federal UI changes waive the job search requirement? To be clear, the answers to these questions have no impact on the underlying economic conditions, which are terrible. However they can have a tremendous impact on what our standard economic data shows. To this end, BLS has a great write-upon
how COVID-19 impacted the March data. They specifically noted that while they instructed their data collectors to code furloughed workers into unemployment, per standard procedures, the actual household survey did see a large increase in workers who had a job, but were not a work for “other reasons.” BLS noted that this increase was just as big at the unemployed increase, meaning the unemployment rate would have increased by nearly 2 percentage points, had they gone into the survey data and re-coded the responses, which they did not. This difference here in how individuals respond to the questions and how they are counted in the data is not trivial for our standard measures! Now the broader measures of unemployment, like U-6, should encapsulatethese changes.
For these reasons, I have put together a highly stylized example for Oregon, although a bit different than the situation that arose in the national data this morning. In the table below I am calculating the unemployment rate if Oregon lost 200,000 jobs. If those workers transition from employment to unemployment then we would see the unemployment rate skyrocket. However if those workers transitioned from employment to not being the labor force, maybe because they no longer have to search for a job to receive the new UI benefits, then the unemployment rate would only increase a little bit. Please keep in mind that this is not a forecast for Oregon’s April unemployment rate. This is just a hypothetical that is designed to show how the data may shake out. There are always lots of individuals flowing into and out of the labor market all the time. Focusing _just_ on initial claims can’t tell you the magnitude of the end results of the household survey, even if it gives a clear indication of where things are headed. We won’t know the final answers until we get the actual data and survey responses in the coming weeks and months. I hope everyone enjoys their weekend. The good news is next week’s weather is supposed to be gorgeous for all of us.4 Comments
Posted in Employment,
Miscellaneous
, News
| Tags: covid19
, initial claims
, Oregon
, UI
, Unemployment
, unemployment
insurance
,
Unemployment Rate
Older Posts »
Older posts
CATEGORIES
* Demographics
* Employment
* Graph of the Week
* Housing
* Income
* Leading Indicators* Miscellaneous
* News
* Revenue
* State Comparisons
TOPICS
* Demographics
* Employment
* Graph of the Week
* Housing
* Income
* Leading Indicators* Miscellaneous
* News
* Revenue
* State Comparisons
CONTACT US
* All Contact Information * Email Josh Directly* Official Site
EMAIL SUBSCRIPTION
Enter your email address to subscribe to this blog and receive notifications of new posts by email. Join 1,315 other followersSign me up!
TWEETS
My Tweets
OLDER POSTS
* May 2020
* April 2020
* March 2020
* February 2020
* January 2020
* December 2019
* November 2019
* October 2019
* September 2019
* August 2019
* July 2019
* June 2019
* May 2019
* April 2019
* March 2019
* February 2019
* January 2019
* December 2018
* November 2018
* October 2018
* September 2018
* August 2018
* July 2018
* June 2018
* May 2018
* April 2018
* March 2018
* February 2018
* January 2018
* December 2017
* November 2017
* October 2017
* September 2017
* August 2017
* July 2017
* June 2017
* May 2017
* April 2017
* March 2017
* February 2017
* January 2017
* December 2016
* November 2016
* October 2016
* September 2016
* August 2016
* July 2016
* June 2016
* May 2016
* April 2016
* March 2016
* February 2016
* January 2016
* December 2015
* November 2015
* October 2015
* September 2015
* August 2015
* July 2015
* June 2015
* May 2015
* April 2015
* March 2015
* February 2015
* January 2015
* December 2014
* November 2014
* October 2014
* September 2014
* August 2014
* July 2014
* June 2014
* May 2014
* April 2014
* March 2014
* February 2014
* January 2014
* December 2013
* November 2013
* October 2013
* September 2013
* August 2013
* July 2013
* June 2013
* May 2013
* April 2013
* March 2013
* February 2013
* January 2013
* December 2012
* November 2012
* October 2012
* September 2012
* August 2012
* July 2012
* June 2012
* May 2012
* April 2012
* March 2012
* February 2012
* January 2012
* December 2011
* November 2011
* October 2011
* September 2011
* August 2011
* July 2011
* June 2011
* May 2011
* April 2011
* March 2011
* February 2011
* January 2011
* December 2010
* November 2010
* October 2010
* September 2010
* August 2010
* July 2010
* June 2010
* May 2010
* April 2010
* March 2010
* MARK MCMULLEN
* JOSH LEHNER
Blog at WordPress.com.Post to
Cancel
* Follow
*
* Oregon Office of Economic Analysis* Customize
* Follow
* Sign up
* Log in
* Report this content * Manage subscriptions* Collapse this bar
Details
2