4
More Annotations


2


5
Favourite Annotations


3


1
Text
INFORMATION IS BEAUTIFULABOUTBLOGDATAONLINE TRAININGBOOKSCONTACT Distilling the world's data, information & knowledge into beautiful infographics & visualizations COVID-19 #CORONAVIRUS INFOGRAPHIC DATAPACK In the US, black and Latino people are 3x more likely to be *infected* by Coronavirus (according to a new analysis of 640,000 infections by the NYTimes – who sued the CDC to get the data). Multiple factors are at play. BAME populations may: : have front-line jobs that keep them working from home, increasing exposure. WORLD’S BIGGEST DATA BREACHES & HACKS Data visualization of the world biggest data breaches, leaks and hacks. Constantly updated. Powered by VizSweet.
BEAUTIFUL NEWS
A project by Information is Beautiful. Feel free to use, download and spread these images as much as you like. They're covered by a CreativeCommons license (CC
LEFT VS RIGHT (WORLD) Left vs Right (World) » Check out our beautiful books. » Learn to be a dataviz ninja: Workshops are Beautiful. » Be the first to know: join our VIP Newsletter. Credits: Concept & Research: David McCandless Design: David McCandless & Stefanie Posavec. Topics: Ideas & Perception. Our monthly newsletter. RHETOLOGICAL FALLACIES A complete interactive list of logical fallacies & rhetorical devices with examples. Code by @omidpyc. Learn to Create Impactful Infographics. The word ‘rhetological’ is made up. TOP 500 MOST COMMON PASSWORDS VISUALIZED Interactive visualization by VizSweet. Also, after some deep analysis, we’ve discovered that passwords fit into 11 categories. See what they are. This interactive Word Cloud is powered by our forthcoming VizSweet software – a set of high-end dataviz tools for generating interactive visualizations.LEFT VS RIGHT V1.5
Left vs Right v1.5. An update of our fabled Left vs Right concept map. Written and art-directed by David McCandless. Designed by Stefanie Posavec. I’ve finally updated this image after lengthy (and sometimes heated) discussion with right wingers. The goal was to smooth out my biases, really. As a left-leaning journalistic type, Ihad subtly
A MATTER OF FACT? THE SCIENCE BEHIND NETFLIX’S “WHAT THESEE MORE ON INFORMATIONISBEAUTIFUL.NETSNAKE OIL VERSION 2
We’ve updated SnakeOil, our interactive “balloon race” visualization of the scientific evidence for over 100 nutritional INFORMATION IS BEAUTIFULABOUTBLOGDATAONLINE TRAININGBOOKSCONTACT Distilling the world's data, information & knowledge into beautiful infographics & visualizations COVID-19 #CORONAVIRUS INFOGRAPHIC DATAPACK In the US, black and Latino people are 3x more likely to be *infected* by Coronavirus (according to a new analysis of 640,000 infections by the NYTimes – who sued the CDC to get the data). Multiple factors are at play. BAME populations may: : have front-line jobs that keep them working from home, increasing exposure. WORLD’S BIGGEST DATA BREACHES & HACKS Data visualization of the world biggest data breaches, leaks and hacks. Constantly updated. Powered by VizSweet.BEAUTIFUL NEWS
A project by Information is Beautiful. Feel free to use, download and spread these images as much as you like. They're covered by a CreativeCommons license (CC
LEFT VS RIGHT (WORLD) Left vs Right (World) » Check out our beautiful books. » Learn to be a dataviz ninja: Workshops are Beautiful. » Be the first to know: join our VIP Newsletter. Credits: Concept & Research: David McCandless Design: David McCandless & Stefanie Posavec. Topics: Ideas & Perception. Our monthly newsletter. RHETOLOGICAL FALLACIES A complete interactive list of logical fallacies & rhetorical devices with examples. Code by @omidpyc. Learn to Create Impactful Infographics. The word ‘rhetological’ is made up. TOP 500 MOST COMMON PASSWORDS VISUALIZED Interactive visualization by VizSweet. Also, after some deep analysis, we’ve discovered that passwords fit into 11 categories. See what they are. This interactive Word Cloud is powered by our forthcoming VizSweet software – a set of high-end dataviz tools for generating interactive visualizations.LEFT VS RIGHT V1.5
Left vs Right v1.5. An update of our fabled Left vs Right concept map. Written and art-directed by David McCandless. Designed by Stefanie Posavec. I’ve finally updated this image after lengthy (and sometimes heated) discussion with right wingers. The goal was to smooth out my biases, really. As a left-leaning journalistic type, Ihad subtly
A MATTER OF FACT? THE SCIENCE BEHIND NETFLIX’S “WHAT THESEE MORE ON INFORMATIONISBEAUTIFUL.NETSNAKE OIL VERSION 2
We’ve updated SnakeOil, our interactive “balloon race” visualization of the scientific evidence for over 100 nutritional ABOUT — INFORMATION IS BEAUTIFUL Founded by David McCandless, author of two bestselling infographics books, Information is Beautiful is dedicated to helping you make clearer, more informed decisions about the world.All our visualizations are based on facts and data: constantly updated, revised and revisioned. DATA VISUALIZATION TRAINING about David. David McCandless is a London-based author, data-journalist and information designer. His best-selling infographic-books Information Is Beautiful and Knowledge is Beautiful are dedicated to visualising ideas, issues, knowledge and data.. His information design work has appeared in hundreds of publications internationally and online including The Guardian, Wired, and the BBC. WORLD DATA VISUALIZATION PRIZE World Data Visualization Prize. Championing the Power of Data Visualization. In partnership with the World Government Summit. We supply the themes and the data. You create a beautiful, intuitive data visualization that tells a story or reveals something interesting. The winners receive cash prizes, international press coverage, and thechance
LEFT VS RIGHT (WORLD) Left vs Right (World) » Check out our beautiful books. » Learn to be a dataviz ninja: Workshops are Beautiful. » Be the first to know: join our VIP Newsletter. Credits: Concept & Research: David McCandless Design: David McCandless & Stefanie Posavec. Topics: Ideas & Perception. Our monthly newsletter. TOP 500 MOST COMMON PASSWORDS VISUALIZED Interactive visualization by VizSweet. Also, after some deep analysis, we’ve discovered that passwords fit into 11 categories. See what they are. This interactive Word Cloud is powered by our forthcoming VizSweet software – a set of high-end dataviz tools for generating interactive visualizations. WHAT MAKES A GOOD DATA VISUALIZATION? What Makes A Good Data Visualization? Hi there. I’m David McCandless, creator of this site and author of two infographic mega-tomes, Information is Beautiful (2009) and Knowledge is Beautiful (2014). I’ve created a lot of data and information visualizations. Around 540 over six years. (An eye-bleeding, marriage-crumplingaverage of 1.7 per
A MATTER OF FACT? THE SCIENCE BEHIND NETFLIX’S “WHAT THE Fact-checking the Netflix vegan documentary What The Health (dir. Kip Andersen). A scene-by-scene, fact-by-fact What The Health fact-checkand review.
WHO OLD ARE YOU?
Who Old Are You? — Information is Beautiful. Who Old Are You? Credits: Design: David McCandless Code: Tom Evans Research: Dr Stephanie Starling, Miriam Quick. Topics: Ideas & Perception. SNAKE OIL SUPPLEMENTS Downgraded: SAMe for depression and vitamin K2 for heart disease, both of which dropped several points. UPDATED July 2018: New entries include melatonin for sleep and Vitamin D for flu, bones and long life. Downgrades for valerian as a cure for anxiety and cranberry juice for urinary infections. New entries for harmful supplements,including
HANS ROSLING
Very sad to hear that Hans Rosling has passed away.Such a grand ninja of dataviz. His spectacular talks convinced me that data stories could be enlightening, illuminating, and entertaining – INFORMATION IS BEAUTIFULABOUTBLOGDATAONLINE TRAININGBOOKSCONTACT Distilling the world's data, information & knowledge into beautiful infographics & visualizations COVID-19 #CORONAVIRUS INFOGRAPHIC DATAPACK UPDATE 14th Apr: Pulled trajectories chart while we work on a new version. UPDATE 1st Apr: Added interactive, generative Fatality Rates by Country (updates twice a day). Thanks to Univers Labs for great work. UPDATE 30th Mar: Added interactive, generative Infection Trajectories (updates twiceBEAUTIFUL NEWS
A project by Information is Beautiful. Feel free to use, download and spread these images as much as you like. They're covered by a CreativeCommons license (CC
WORLD’S BIGGEST DATA BREACHES & HACKS Data visualization of the world biggest data breaches, leaks and hacks. Constantly updated. Powered by VizSweet. DATA VISUALIZATION TRAINING about David. David McCandless is a London-based author, data-journalist and information designer. His best-selling infographic-books Information Is Beautiful and Knowledge is Beautiful are dedicated to visualising ideas, issues, knowledge and data.. His information design work has appeared in hundreds of publications internationally and online including The Guardian, Wired, and the BBC. LEFT VS RIGHT (WORLD) Left vs Right (World) — Information is Beautiful WHEN SEA LEVELS ATTACK! When Sea Levels Attack! — Information is Beautiful SNAKE OIL SUPERFOODS? SNAKE OIL SUPPLEMENTS Do echinacea & Vitamin C kill colds? Will turmeric, goji berries or wheatgrass help you live to 150? The supplements that pass randomised, controlled trialsand the ones that are snake oil. SNAKE OIL? SCIENTIFIC EVIDENCE FOR HEALTH SUPPLEMENTS play with the interactive version. UPDATE 5 – 8th Jan 2014 – Lots of new research and studies – don’t miss the interactive UPDATE 2 – 1st October 2010 –Top to bottom revise of the data.See the change log for details. UPDATE 1 – 21st March 2010 – We’ve updated our data thanks to excellent visitor feedback and new evidence. See the change log for details. INFORMATION IS BEAUTIFULABOUTBLOGDATAONLINE TRAININGBOOKSCONTACT Distilling the world's data, information & knowledge into beautiful infographics & visualizations COVID-19 #CORONAVIRUS INFOGRAPHIC DATAPACK UPDATE 14th Apr: Pulled trajectories chart while we work on a new version. UPDATE 1st Apr: Added interactive, generative Fatality Rates by Country (updates twice a day). Thanks to Univers Labs for great work. UPDATE 30th Mar: Added interactive, generative Infection Trajectories (updates twiceBEAUTIFUL NEWS
A project by Information is Beautiful. Feel free to use, download and spread these images as much as you like. They're covered by a CreativeCommons license (CC
WORLD’S BIGGEST DATA BREACHES & HACKS Data visualization of the world biggest data breaches, leaks and hacks. Constantly updated. Powered by VizSweet. DATA VISUALIZATION TRAINING about David. David McCandless is a London-based author, data-journalist and information designer. His best-selling infographic-books Information Is Beautiful and Knowledge is Beautiful are dedicated to visualising ideas, issues, knowledge and data.. His information design work has appeared in hundreds of publications internationally and online including The Guardian, Wired, and the BBC. LEFT VS RIGHT (WORLD) Left vs Right (World) — Information is Beautiful WHEN SEA LEVELS ATTACK! When Sea Levels Attack! — Information is Beautiful SNAKE OIL SUPERFOODS? SNAKE OIL SUPPLEMENTS Do echinacea & Vitamin C kill colds? Will turmeric, goji berries or wheatgrass help you live to 150? The supplements that pass randomised, controlled trialsand the ones that are snake oil. SNAKE OIL? SCIENTIFIC EVIDENCE FOR HEALTH SUPPLEMENTS play with the interactive version. UPDATE 5 – 8th Jan 2014 – Lots of new research and studies – don’t miss the interactive UPDATE 2 – 1st October 2010 –Top to bottom revise of the data.See the change log for details. UPDATE 1 – 21st March 2010 – We’ve updated our data thanks to excellent visitor feedback and new evidence. See the change log for details. ABOUT — INFORMATION IS BEAUTIFUL Founded by David McCandless, author of two bestselling infographics books, Information is Beautiful is dedicated to helping you make clearer, more informed decisions about the world.All our visualizations are based on facts and data: constantly updated, revised and revisioned. MEET OUR BEAUTIFUL TEAM! Based in Italy. Trained designer, self-taught coder. When not working for IIB, can be found teaching at a design school, consulting for a company or putting together a personal datavizor maybe at the espresso machine.Favorite weapons: creative thinking, illustrator & D3. DATA VISUALIZATION TRAINING about David. David McCandless is a London-based author, data-journalist and information designer. His best-selling infographic-books Information Is Beautiful and Knowledge is Beautiful are dedicated to visualising ideas, issues, knowledge and data.. His information design work has appeared in hundreds of publications internationally and online including The Guardian, Wired, and the BBC.LEFT VS. RIGHT (US)
� See our beautiful infographic books. This graphic shows left & right, liberal vs conservative, blue vs red, from a US perspective. In other countries the associations may differ.See the ‘World’version
TOP 500 MOST COMMON PASSWORDS VISUALIZED Most common passwords, deep-mined from 20 separate data breaches.Is yours here? Interactive visualization by VizSweet. » See the data analysis. Also, after some deep analysis, we’ve discovered that passwords fit into 11 categories. A MATTER OF FACT? THE SCIENCE BEHIND NETFLIX’S “WHAT THE Fact-checking the Netflix vegan documentary What The Health (dir. Kip Andersen). A scene-by-scene, fact-by-fact What The Health fact-checkand review.
RHETOLOGICAL FALLACIES A complete interactive list of logical fallacies & rhetorical devices with examples. Code by @omidpyc. Learn to Create Impactful Infographics. The word ‘rhetological’ is made up.BEST IN SHOW
If you look at the numbers, which canine comes out as top data-dog? Which are the best dog breeds according to the data? A visualisation from my book, Knowledge is Beautiful We examined data on intelligence, longevity, genetic ailments and other markers to create a “data-score” and then plotted it against public popularity of various breeds, according to the American Kennel Club. THE BILLION DOLLAR-O-GRAM What does a billion dollars look like? 100 billion? 1,000 billion? Explore this data-visualisations of billion dollar amounts. ISLAMIC SECTS, SCHOOLS, BRANCHES & MOVEMENTS Sunni? Shia? Hanbali? Ismali? Deobandi? A visual guide to the major & notable sects, schools & movements within Islam. This is an ongoing, evolving diagram which we hope to add to. INFORMATION IS BEAUTIFUL__
SECTIONS
* home
* everything
* about
* blog
* data
* training
* books
* contact
TRENDING
* interactive
* belief
* food
* health
* ideas
* science
* web-tech
CONNECT
* __facebook
* __twitter
* __instagram
* __pinterest
* __RSS feed
* __facebook
* __twitter
* __instagram
* __RSS feed
*
*
SEARCH
__ Search
E.G:
* Billion dollar-o-gram * Based on a true story * Mountains out of molehills*
CATEGORIES
* interactive
* belief
* food
* health
* ideas
* science
* web-tech
*
POPULAR
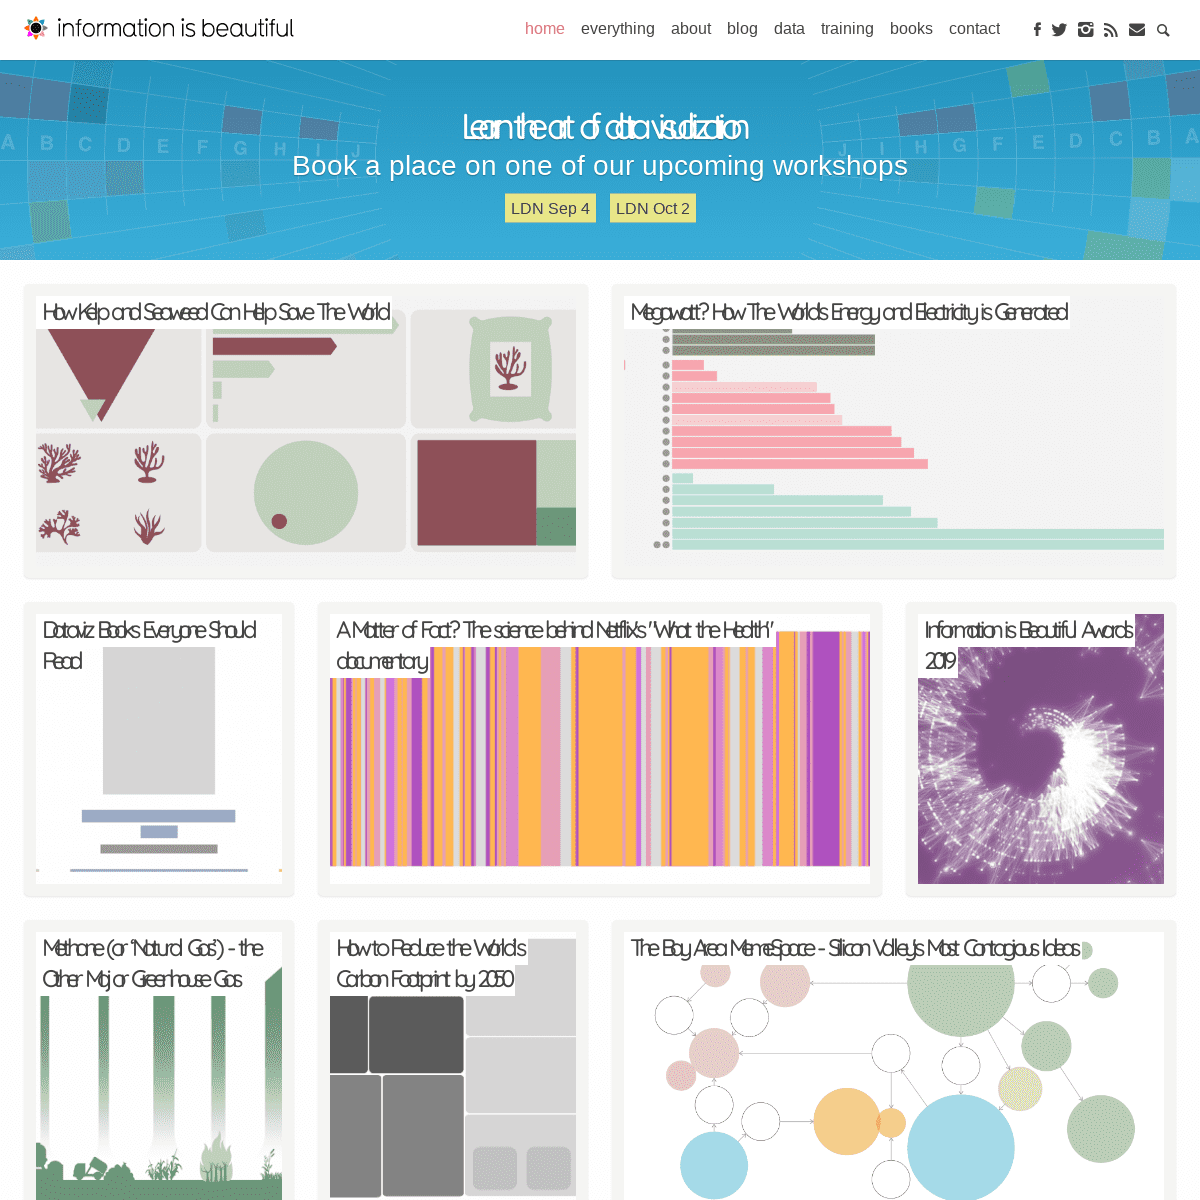
* How Kelp and Seaweed Can Help Save The World * Megawatt? How The World's Energy and Electricity is Generated * Dataviz Books Everyone Should Read * A Matter of Fact? The science behind Netflix's "What the Health"documentary
* Information is Beautiful Awards 2019*
FOLLOW IIB
* __
* __
* __
* __
* __
* __
NEVER MISS ANOTHER BEAUTIFUL GRAPHIC Subscribe Enter your email address to get spam-free viz updates straight to your inbox! NEVER MISS ANOTHER BEAUTIFUL GRAPHIC Subscribe ENTER YOUR EMAIL ADDRESS TO GET SPAM-FREE VIZ UPDATES STRAIGHT TO YOUR INBOX! LEARN THE ART OF DATA VISUALIZATION Book a place on one of our upcoming workshopsLDN Sep 4
LDN Oct 2
HOW KELP AND SEAWEED CAN HELP SAVE THE WORLD MEGAWATT? HOW THE WORLD'S ENERGY AND ELECTRICITY IS GENERATED DATAVIZ BOOKS EVERYONE SHOULD READ A MATTER OF FACT? THE SCIENCE BEHIND NETFLIX'S "WHAT THE HEALTH"DOCUMENTARY
INFORMATION IS BEAUTIFUL AWARDS 2019 METHANE (OR ‘NATURAL GAS’) - THE OTHER MAJOR GREENHOUSE GAS HOW TO REDUCE THE WORLD’S CARBON FOOTPRINT BY 2050 THE BAY AREA MEMESPACE - SILICON VALLEY'S MOST CONTAGIOUS IDEAS WHAT COULD REALLY INCREASE YOUR LIFE EXPECTANCY, LIFESPAN ANDLONGEVITY?
WDVP GALLERY 2019
TRILLIONS - WHAT IS A TRILLION DOLLARS? WHAT ISLAMIC GOLDEN AGE THINKERS DISCOVERED LONG BEFORE THE WESTEast before West
see more →
NEVER MISS ANOTHER BEAUTIFUL GRAPHICSubscribe
LIVING DATA
DIVERSITY IN TECH
GENDER PAY GAP UK
Spot the UK jobs where women are paid more than men CAUSE CÉLÈBRE - GENDER SPLIT BEHIND CELEBRITY CHARITABLE GIVING &CAUSES
INTERACTIVE
THE HOLLYWOOD IN$IDER Visual data-explorer for every major movie (2008-2016) SNAKE OIL SUPERFOODS? OIL WELL - EVERY COOKING OIL COMPAREDsee more →
MOST POPULAR
WORLD'S BIGGEST DATA BREACHES & HACKSLEFT VS. RIGHT (US)
BEST IN SHOW - WHAT'S THE BEST DOG BREED, ACCORDING TO DATA? BASED ON A *TRUE* TRUE STORY? Scene-by-scene breakdown of Hollywood "true stories" WHAT COULD REALLY INCREASE YOUR LIFE EXPECTANCY, LIFESPAN ANDLONGEVITY?
RHETOLOGICAL FALLACIES - A LIST OF LOGICAL FALLACIES & RHETORICAL DEVICES WITH EXAMPLES Errors & manipulation of rhetoric and logical thinkingOUR BOOKS
INFORMATION IS BEAUTIFUL THE VISUAL MISCELLANEUM KNOWLEDGE IS BEAUTIFULKINDLE EDITION
see more →
UPCOMING WORKSHOPS IN LONDON BOOK NOW! SEARCH INFORMATION IS BEAUTIFUL:__ Search
MENU
* Home
* About
* Contact
OUR PICKS
* Living data
* Buy our books
* Interactive
MORE
* IIB Awards
* David McCandless
* VizSweet
FOLLOW
* __
* __
* __
* __
* __
* __
Information is Beautiful� 2007 — 2019
Close ×
Details
2