1
More Annotations


3


2
Favourite Annotations


1


1
Text
HCISTATS:START
Nevertheless, NHST is still the major statistical method used in the field of HCI, and this wiki aims to promote the understanding of NHST and encourage discussions about how this research community should move forward in statistical analysis practices. This is another paper talking about how we need to be careful to interpret the results ofNHST.
HCISTATS:DATATYPE
Interval: The data which you can order and the difference between any of two values are the same, but there is no absolute zero, which allows us to have meaningful negative values.The most famous example is temperature with C or F. 0 C or 0 F are artificially defined and negative values can beHCISTATS:EFFECTSIZE
Thus, we want to have some metrics which do not depend on the sample size, and show the size of the effect. Effect size is the metric that indicates the magnitude of the effect caused by a factor. The effect size is independent of the sample size. Thus, the effect size can complement some of the shortcomings of the NHST and p value.HCISTATS:CHISQUARE
A Chi-square test is a common test for nominal (categorical) data. One application of a Chi-square test is a test for independence. In this case, the null hypothesis is that the occurrence of the outcomes for the two groups is equal. For example, you have two user groups ( e.g., HCISTATS:LINEARREGRESSION Yes, you can do regression with non-linear models. One of the most common non-linear regression is logistic regression.But generally, it is rare to see regression other than linear regression in HCI research, and I don't have any good example of the cases in which you really need to use non-linear regression. HCISTATS:MULTIPLEREGRESSION AIC is a common metric used in model selection. AIC is defined as follows: AIC = -2 log (L) + 2 k, . where L is the likelihood of the model, and k is the number of variables in the model. If your model is far from the measurement (in other words, the goodness of fit is low), L becomes really small (e.g., log(L) becomes negative hundreds) , andAIC becomes large.
HCISTATS:ANOVA
Introduction. Analysis of Variance (ANOVA) is one statistical test commonly used in HCI research. Although it says “analysis of variance,” and ANOVA is a method to compare multiple linear models, a very common way to use an ANOVA test is to test the difference in means among more than two groups. So, the intuition is a t test whichHCISTATS:CA
Let's say you asked the participants questions about what they expect for computers depending on the OS.You prepared four descriptions: Software: There are many available software packages; Design: The aesthetics is better; Flexibility: This OS is the most customizable; and Price: This OS is most affordable. You asked the participants which OS each description is associated with best.KOJI YATANI, PH.D.
CURRICULUM VITAE Koji Yatani, Ph.D. December, 2016 PERSONAL DATA Affiliation The University of Tokyo Title Associate Professor E-mailkoji@iis-lab.org
2016HCI:PAPERASSIGNMENT Please post your paper preferences in this thread. Choose at least five papers from the reading list. Use the following template for your post. If you do not name your preference, IHCISTATS:START
Nevertheless, NHST is still the major statistical method used in the field of HCI, and this wiki aims to promote the understanding of NHST and encourage discussions about how this research community should move forward in statistical analysis practices. This is another paper talking about how we need to be careful to interpret the results ofNHST.
HCISTATS:DATATYPE
Interval: The data which you can order and the difference between any of two values are the same, but there is no absolute zero, which allows us to have meaningful negative values.The most famous example is temperature with C or F. 0 C or 0 F are artificially defined and negative values can beHCISTATS:EFFECTSIZE
Thus, we want to have some metrics which do not depend on the sample size, and show the size of the effect. Effect size is the metric that indicates the magnitude of the effect caused by a factor. The effect size is independent of the sample size. Thus, the effect size can complement some of the shortcomings of the NHST and p value.HCISTATS:CHISQUARE
A Chi-square test is a common test for nominal (categorical) data. One application of a Chi-square test is a test for independence. In this case, the null hypothesis is that the occurrence of the outcomes for the two groups is equal. For example, you have two user groups ( e.g., HCISTATS:LINEARREGRESSION Yes, you can do regression with non-linear models. One of the most common non-linear regression is logistic regression.But generally, it is rare to see regression other than linear regression in HCI research, and I don't have any good example of the cases in which you really need to use non-linear regression. HCISTATS:MULTIPLEREGRESSION AIC is a common metric used in model selection. AIC is defined as follows: AIC = -2 log (L) + 2 k, . where L is the likelihood of the model, and k is the number of variables in the model. If your model is far from the measurement (in other words, the goodness of fit is low), L becomes really small (e.g., log(L) becomes negative hundreds) , andAIC becomes large.
HCISTATS:ANOVA
Introduction. Analysis of Variance (ANOVA) is one statistical test commonly used in HCI research. Although it says “analysis of variance,” and ANOVA is a method to compare multiple linear models, a very common way to use an ANOVA test is to test the difference in means among more than two groups. So, the intuition is a t test whichHCISTATS:CA
Let's say you asked the participants questions about what they expect for computers depending on the OS.You prepared four descriptions: Software: There are many available software packages; Design: The aesthetics is better; Flexibility: This OS is the most customizable; and Price: This OS is most affordable. You asked the participants which OS each description is associated with best.KOJI YATANI, PH.D.
CURRICULUM VITAE Koji Yatani, Ph.D. December, 2016 PERSONAL DATA Affiliation The University of Tokyo Title Associate Professor E-mailkoji@iis-lab.org
2016HCI:PAPERASSIGNMENT Please post your paper preferences in this thread. Choose at least five papers from the reading list. Use the following template for your post. If you do not name your preference, IHCISTATS:CA
Let's say you asked the participants questions about what they expect for computers depending on the OS.You prepared four descriptions: Software: There are many available software packages; Design: The aesthetics is better; Flexibility: This OS is the most customizable; and Price: This OS is most affordable. You asked the participants which OS each description is associated with best.HCISTATS:PCA
From the second table (loadings), PCA found four new variables which can explain the same information as the original four variables (Price, Software, Aesthetics, and Brand), which are Comp.1 to Comp.4.HCISTATS:COCHRAN
Simply speaking, Cochran's Q test is a binomial data version of repeated-measure ANOVA or Friedman test.So, you have multiple binomial data (like “yes” or “no” responses), and you want to see whether the ratio of the responses are different across the groups (e.g., methods, software or devices the participant use).Let's say you have data as follows. HCISTATS:DATATRANSFORMATION Generally, Kolmogorov-Smirnov test becomes less sensitive (less powerful to detect a significant effect) when the sample size is small. It is hard to say which number is considered as small or large, but it is said that Kolmogorov-Smirnov test is more appropriate if your sample size is the order of 1000.HCISTATS:RTIPS
In this page, I put some commands/ways that I found useful for analyzing your data more quickly and effectively. If you are a beginner of R, you should take a look at the intro pdf provided by R project first. There are many online materials for R, so you should doonline search.
HCISTATS:CROSSTAB
This crosstab table shows the distribution of the ownership of the two devices separated by users' ages. From this table, it looks like the age affects the ownership of the device (i.e., younger users tend to like owing Device A and older users tend to like owing Device HCISTATS:KRUSKALWALLIS Kruskal-Wallis is basically a non-parametric version of ANOVA.Thus, if you have the data which contain more than two groups to compare, and your data are ordinal or your data cannot assume the normality, Kruskal-Wallis is the way to go.KOJI YATANI, PH.D.
CURRICULUM VITAE Koji Yatani, Ph.D. December, 2016 PERSONAL DATA Affiliation The University of Tokyo Title Associate Professor E-mailkoji@iis-lab.org
HCISTATS:POWERANALYSIS Probably, the most important way to use power analysis is to estimate a sample size to get the desired alpha and power. As explained in the section above, as long as you have three parameters, you can calculatethe rest parameter.
ADVANCED TOPICS IN HCI: MOBILE AND UBIQUITOUS COMPUTINGWEB VIEW Advanced Topics in HCI: Mobile and Ubiquitous Computing (Fall 2013) Assignment B Submission Form. Before filling out the form, read the instruction on the course webpage carefully.HCISTATS:START
Nevertheless, NHST is still the major statistical method used in the field of HCI, and this wiki aims to promote the understanding of NHST and encourage discussions about how this research community should move forward in statistical analysis practices. This is another paper talking about how we need to be careful to interpret the results ofNHST.
HCISTATS:DATATYPE
Interval: The data which you can order and the difference between any of two values are the same, but there is no absolute zero, which allows us to have meaningful negative values.The most famous example is temperature with C or F. 0 C or 0 F are artificially defined and negative values can beHCISTATS:EFFECTSIZE
Thus, we want to have some metrics which do not depend on the sample size, and show the size of the effect. Effect size is the metric that indicates the magnitude of the effect caused by a factor. The effect size is independent of the sample size. Thus, the effect size can complement some of the shortcomings of the NHST and p value.HCISTATS:CHISQUARE
A Chi-square test is a common test for nominal (categorical) data. One application of a Chi-square test is a test for independence. In this case, the null hypothesis is that the occurrence of the outcomes for the two groups is equal. For example, you have two user groups ( e.g., HCISTATS:LINEARREGRESSION Yes, you can do regression with non-linear models. One of the most common non-linear regression is logistic regression.But generally, it is rare to see regression other than linear regression in HCI research, and I don't have any good example of the cases in which you really need to use non-linear regression. HCISTATS:MULTIPLEREGRESSION AIC is a common metric used in model selection. AIC is defined as follows: AIC = -2 log (L) + 2 k, . where L is the likelihood of the model, and k is the number of variables in the model. If your model is far from the measurement (in other words, the goodness of fit is low), L becomes really small (e.g., log(L) becomes negative hundreds) , andAIC becomes large.
HCISTATS:ANOVA
Introduction. Analysis of Variance (ANOVA) is one statistical test commonly used in HCI research. Although it says “analysis of variance,” and ANOVA is a method to compare multiple linear models, a very common way to use an ANOVA test is to test the difference in means among more than two groups. So, the intuition is a t test whichHCISTATS:CA
Let's say you asked the participants questions about what they expect for computers depending on the OS.You prepared four descriptions: Software: There are many available software packages; Design: The aesthetics is better; Flexibility: This OS is the most customizable; and Price: This OS is most affordable. You asked the participants which OS each description is associated with best.KOJI YATANI, PH.D.
CURRICULUM VITAE Koji Yatani, Ph.D. December, 2016 PERSONAL DATA Affiliation The University of Tokyo Title Associate Professor E-mailkoji@iis-lab.org
2016HCI:PAPERASSIGNMENT Please post your paper preferences in this thread. Choose at least five papers from the reading list. Use the following template for your post. If you do not name your preference, IHCISTATS:START
Nevertheless, NHST is still the major statistical method used in the field of HCI, and this wiki aims to promote the understanding of NHST and encourage discussions about how this research community should move forward in statistical analysis practices. This is another paper talking about how we need to be careful to interpret the results ofNHST.
HCISTATS:DATATYPE
Interval: The data which you can order and the difference between any of two values are the same, but there is no absolute zero, which allows us to have meaningful negative values.The most famous example is temperature with C or F. 0 C or 0 F are artificially defined and negative values can beHCISTATS:EFFECTSIZE
Thus, we want to have some metrics which do not depend on the sample size, and show the size of the effect. Effect size is the metric that indicates the magnitude of the effect caused by a factor. The effect size is independent of the sample size. Thus, the effect size can complement some of the shortcomings of the NHST and p value.HCISTATS:CHISQUARE
A Chi-square test is a common test for nominal (categorical) data. One application of a Chi-square test is a test for independence. In this case, the null hypothesis is that the occurrence of the outcomes for the two groups is equal. For example, you have two user groups ( e.g., HCISTATS:LINEARREGRESSION Yes, you can do regression with non-linear models. One of the most common non-linear regression is logistic regression.But generally, it is rare to see regression other than linear regression in HCI research, and I don't have any good example of the cases in which you really need to use non-linear regression. HCISTATS:MULTIPLEREGRESSION AIC is a common metric used in model selection. AIC is defined as follows: AIC = -2 log (L) + 2 k, . where L is the likelihood of the model, and k is the number of variables in the model. If your model is far from the measurement (in other words, the goodness of fit is low), L becomes really small (e.g., log(L) becomes negative hundreds) , andAIC becomes large.
HCISTATS:ANOVA
Introduction. Analysis of Variance (ANOVA) is one statistical test commonly used in HCI research. Although it says “analysis of variance,” and ANOVA is a method to compare multiple linear models, a very common way to use an ANOVA test is to test the difference in means among more than two groups. So, the intuition is a t test whichHCISTATS:CA
Let's say you asked the participants questions about what they expect for computers depending on the OS.You prepared four descriptions: Software: There are many available software packages; Design: The aesthetics is better; Flexibility: This OS is the most customizable; and Price: This OS is most affordable. You asked the participants which OS each description is associated with best.KOJI YATANI, PH.D.
CURRICULUM VITAE Koji Yatani, Ph.D. December, 2016 PERSONAL DATA Affiliation The University of Tokyo Title Associate Professor E-mailkoji@iis-lab.org
2016HCI:PAPERASSIGNMENT Please post your paper preferences in this thread. Choose at least five papers from the reading list. Use the following template for your post. If you do not name your preference, IHCISTATS:CA
Let's say you asked the participants questions about what they expect for computers depending on the OS.You prepared four descriptions: Software: There are many available software packages; Design: The aesthetics is better; Flexibility: This OS is the most customizable; and Price: This OS is most affordable. You asked the participants which OS each description is associated with best.HCISTATS:PCA
From the second table (loadings), PCA found four new variables which can explain the same information as the original four variables (Price, Software, Aesthetics, and Brand), which are Comp.1 to Comp.4.HCISTATS:COCHRAN
Simply speaking, Cochran's Q test is a binomial data version of repeated-measure ANOVA or Friedman test.So, you have multiple binomial data (like “yes” or “no” responses), and you want to see whether the ratio of the responses are different across the groups (e.g., methods, software or devices the participant use).Let's say you have data as follows. HCISTATS:DATATRANSFORMATION Generally, Kolmogorov-Smirnov test becomes less sensitive (less powerful to detect a significant effect) when the sample size is small. It is hard to say which number is considered as small or large, but it is said that Kolmogorov-Smirnov test is more appropriate if your sample size is the order of 1000.HCISTATS:RTIPS
In this page, I put some commands/ways that I found useful for analyzing your data more quickly and effectively. If you are a beginner of R, you should take a look at the intro pdf provided by R project first. There are many online materials for R, so you should doonline search.
HCISTATS:CROSSTAB
This crosstab table shows the distribution of the ownership of the two devices separated by users' ages. From this table, it looks like the age affects the ownership of the device (i.e., younger users tend to like owing Device A and older users tend to like owing Device HCISTATS:KRUSKALWALLIS Kruskal-Wallis is basically a non-parametric version of ANOVA.Thus, if you have the data which contain more than two groups to compare, and your data are ordinal or your data cannot assume the normality, Kruskal-Wallis is the way to go.KOJI YATANI, PH.D.
CURRICULUM VITAE Koji Yatani, Ph.D. December, 2016 PERSONAL DATA Affiliation The University of Tokyo Title Associate Professor E-mailkoji@iis-lab.org
HCISTATS:POWERANALYSIS Probably, the most important way to use power analysis is to estimate a sample size to get the desired alpha and power. As explained in the section above, as long as you have three parameters, you can calculatethe rest parameter.
ADVANCED TOPICS IN HCI: MOBILE AND UBIQUITOUS COMPUTINGWEB VIEW Advanced Topics in HCI: Mobile and Ubiquitous Computing (Fall 2013) Assignment B Submission Form. Before filling out the form, read the instruction on the course webpage carefully.KOJI YATANI, PH.D.
If you want a high resolution version of these videos (MPEG-1 format), please drop an email to me (koji_at_dgp.toronto.edu).HCISTATS:START
Nevertheless, NHST is still the major statistical method used in the field of HCI, and this wiki aims to promote the understanding of NHST and encourage discussions about how this research community should move forward in statistical analysis practices. This is another paper talking about how we need to be careful to interpret the results ofNHST.
HCISTATS:TTEST
For t tests, you probably also want to report the effect size. The general explanation of effect sizes is available here, and here I explain how to calculate the effect size for a t test.. There are two kinds of effect size metrics for a t test: Cohen's d, and Pearson's r.Both metrics are commonly used and you can pick up either of them (there is a way to convert d to r, and vice versa, so it HCISTATS:LINEARREGRESSION Yes, you can do regression with non-linear models. One of the most common non-linear regression is logistic regression.But generally, it is rare to see regression other than linear regression in HCI research, and I don't have any good example of the cases in which you really need to use non-linear regression.HCISTATS:CHISQUARE
A Chi-square test is a common test for nominal (categorical) data. One application of a Chi-square test is a test for independence. In this case, the null hypothesis is that the occurrence of the outcomes for the two groups is equal. For example, you have two user groups ( e.g.,HCISTATS:EFFECTSIZE
Thus, we want to have some metrics which do not depend on the sample size, and show the size of the effect. Effect size is the metric that indicates the magnitude of the effect caused by a factor. The effect size is independent of the sample size. Thus, the effect size can complement some of the shortcomings of the NHST and p value.KOJI YATANI, PH.D.
CURRICULUM VITAE Koji Yatani, Ph.D. December, 2016 PERSONAL DATA Affiliation The University of Tokyo Title Associate Professor E-mailkoji@iis-lab.org
HCISTATS:POSTHOC
The strict definition of a post-hoc test means a test which does not require any plan for testing. In the four examples above, only Case 1 satisfies the strict definition of a post-hoc test because the others cases require some sort of planning on which groups to compare or notto compare.
HCISTATS:CA
Let's say you asked the participants questions about what they expect for computers depending on the OS.You prepared four descriptions: Software: There are many available software packages; Design: The aesthetics is better; Flexibility: This OS is the most customizable; and Price: This OS is most affordable. You asked the participants which OS each description is associated with best. 2016HCI:PAPERASSIGNMENT Please post your paper preferences in this thread. Choose at least five papers from the reading list. Use the following template for your post. If you do not name your preference, I will pick up a paper foryou.
KOJI YATANI, PH.D.
If you want a high resolution version of these videos (MPEG-1 format), please drop an email to me (koji_at_dgp.toronto.edu).HCISTATS:CA
Let's say you asked the participants questions about what they expect for computers depending on the OS.You prepared four descriptions: Software: There are many available software packages; Design: The aesthetics is better; Flexibility: This OS is the most customizable; and Price: This OS is most affordable. You asked the participants which OS each description is associated with best.HCISTATS:ANOVA
Introduction. Analysis of Variance (ANOVA) is one statistical test commonly used in HCI research. Although it says “analysis of variance,” and ANOVA is a method to compare multiple linear models, a very common way to use an ANOVA test is to test the difference in means among more than two groups. So, the intuition is a t test which HCISTATS:DATATRANSFORMATION Generally, Kolmogorov-Smirnov test becomes less sensitive (less powerful to detect a significant effect) when the sample size is small. It is hard to say which number is considered as small or large, but it is said that Kolmogorov-Smirnov test is more appropriate if your sample size is the order of 1000.KOJI YATANI, PH.D.
CURRICULUM VITAE Koji Yatani, Ph.D. December, 2016 PERSONAL DATA Affiliation The University of Tokyo Title Associate Professor E-mailkoji@iis-lab.org
HCISTATS:POWERANALYSIS Probably, the most important way to use power analysis is to estimate a sample size to get the desired alpha and power. As explained in the section above, as long as you have three parameters, you can calculatethe rest parameter.
HCISTATS:RTIPS
In this page, I put some commands/ways that I found useful for analyzing your data more quickly and effectively. If you are a beginner of R, you should take a look at the intro pdf provided by R project first. There are many online materials for R, so you should doonline search.
HCISTATS:CROSSTAB
This crosstab table shows the distribution of the ownership of the two devices separated by users' ages. From this table, it looks like the age affects the ownership of the device (i.e., younger users tend to like owing Device A and older users tend to like owing Device 2016HCI:PAPERASSIGNMENT Please post your paper preferences in this thread. Choose at least five papers from the reading list. Use the following template for your post. If you do not name your preference, I will pick up a paper foryou.
ADVANCED TOPICS IN HCI: MOBILE AND UBIQUITOUS COMPUTINGWEB VIEW Advanced Topics in HCI: Mobile and Ubiquitous Computing (Fall 2013) Assignment B Submission Form. Before filling out the form, read the instruction on the course webpage carefully.KOJI YATANI, PH.D.
If you want a high resolution version of these videos (MPEG-1 format), please drop an email to me (koji_at_dgp.toronto.edu).HCISTATS:START
Nevertheless, NHST is still the major statistical method used in the field of HCI, and this wiki aims to promote the understanding of NHST and encourage discussions about how this research community should move forward in statistical analysis practices. This is another paper talking about how we need to be careful to interpret the results ofNHST.
HCISTATS:EFFECTSIZE
Thus, we want to have some metrics which do not depend on the sample size, and show the size of the effect. Effect size is the metric that indicates the magnitude of the effect caused by a factor. The effect size is independent of the sample size. Thus, the effect size can complement some of the shortcomings of the NHST and p value.HCISTATS:DATATYPE
Interval: The data which you can order and the difference between any of two values are the same, but there is no absolute zero, which allows us to have meaningful negative values.The most famous example is temperature with C or F. 0 C or 0 F are artificially defined and negative values can beHCISTATS:TTEST
For t tests, you probably also want to report the effect size. The general explanation of effect sizes is available here, and here I explain how to calculate the effect size for a t test.. There are two kinds of effect size metrics for a t test: Cohen's d, and Pearson's r.Both metrics are commonly used and you can pick up either of them (there is a way to convert d to r, and vice versa, so it HCISTATS:LINEARREGRESSION Yes, you can do regression with non-linear models. One of the most common non-linear regression is logistic regression.But generally, it is rare to see regression other than linear regression in HCI research, and I don't have any good example of the cases in which you really need to use non-linear regression.HCISTATS:CA
Let's say you asked the participants questions about what they expect for computers depending on the OS.You prepared four descriptions: Software: There are many available software packages; Design: The aesthetics is better; Flexibility: This OS is the most customizable; and Price: This OS is most affordable. You asked the participants which OS each description is associated with best.HCISTATS:CHISQUARE
A Chi-square test is a common test for nominal (categorical) data. One application of a Chi-square test is a test for independence. In this case, the null hypothesis is that the occurrence of the outcomes for the two groups is equal. For example, you have two user groups ( e.g.,HCISTATS:ANOVA
Introduction. Analysis of Variance (ANOVA) is one statistical test commonly used in HCI research. Although it says “analysis of variance,” and ANOVA is a method to compare multiple linear models, a very common way to use an ANOVA test is to test the difference in means among more than two groups. So, the intuition is a t test which 2016HCI:PAPERASSIGNMENT Please post your paper preferences in this thread. Choose at least five papers from the reading list. Use the following template for your post. If you do not name your preference, I will pick up a paper foryou.
KOJI YATANI, PH.D.
If you want a high resolution version of these videos (MPEG-1 format), please drop an email to me (koji_at_dgp.toronto.edu).HCISTATS:PCA
From the second table (loadings), PCA found four new variables which can explain the same information as the original four variables (Price, Software, Aesthetics, and Brand), which are Comp.1 to Comp.4.HCISTATS:FA
Factor Analysis is another powerful tool to understand what your data mean particularly when you have many variables. What Factor Analysis does is to try to find hidden variables which explain the behavior of your observed variables. Our interests here also lie in reducing the number of variables. So, we hope that we can find a smaller number HCISTATS:POWERANALYSIS Probably, the most important way to use power analysis is to estimate a sample size to get the desired alpha and power. As explained in the section above, as long as you have three parameters, you can calculatethe rest parameter.
HCISTATS:KRUSKALWALLIS Kruskal-Wallis is basically a non-parametric version of ANOVA.Thus, if you have the data which contain more than two groups to compare, and your data are ordinal or your data cannot assume the normality, Kruskal-Wallis is the way to go.HCISTATS:CROSSTAB
This crosstab table shows the distribution of the ownership of the two devices separated by users' ages. From this table, it looks like the age affects the ownership of the device (i.e., younger users tend to like owing Device A and older users tend to like owing DeviceKOJI YATANI, PH.D.
CURRICULUM VITAE Koji Yatani, Ph.D. December, 2016 PERSONAL DATA Affiliation The University of Tokyo Title Associate Professor E-mailkoji@iis-lab.org
HCISTATS:RTIPS
In this page, I put some commands/ways that I found useful for analyzing your data more quickly and effectively. If you are a beginner of R, you should take a look at the intro pdf provided by R project first. There are many online materials for R, so you should doonline search.
2016HCI:PAPERASSIGNMENT Please post your paper preferences in this thread. Choose at least five papers from the reading list. Use the following template for your post. If you do not name your preference, I will pick up a paper foryou.
ADVANCED TOPICS IN HCI: MOBILE AND UBIQUITOUS COMPUTINGWEB VIEW Advanced Topics in HCI: Mobile and Ubiquitous Computing (Fall 2013) Assignment D Submission Form. Before filling out the form, read the instruction on the course webpage carefully.KOJI YATANI, PH.D.
If you want a high resolution version of these videos (MPEG-1 format), please drop an email to me (koji_at_dgp.toronto.edu).HCISTATS:START
Nevertheless, NHST is still the major statistical method used in the field of HCI, and this wiki aims to promote the understanding of NHST and encourage discussions about how this research community should move forward in statistical analysis practices. This is another paper talking about how we need to be careful to interpret the results ofNHST.
HCISTATS:EFFECTSIZE
Thus, we want to have some metrics which do not depend on the sample size, and show the size of the effect. Effect size is the metric that indicates the magnitude of the effect caused by a factor. The effect size is independent of the sample size. Thus, the effect size can complement some of the shortcomings of the NHST and p value.HCISTATS:DATATYPE
Interval: The data which you can order and the difference between any of two values are the same, but there is no absolute zero, which allows us to have meaningful negative values.The most famous example is temperature with C or F. 0 C or 0 F are artificially defined and negative values can beHCISTATS:TTEST
For t tests, you probably also want to report the effect size. The general explanation of effect sizes is available here, and here I explain how to calculate the effect size for a t test.. There are two kinds of effect size metrics for a t test: Cohen's d, and Pearson's r.Both metrics are commonly used and you can pick up either of them (there is a way to convert d to r, and vice versa, so it HCISTATS:LINEARREGRESSION Yes, you can do regression with non-linear models. One of the most common non-linear regression is logistic regression.But generally, it is rare to see regression other than linear regression in HCI research, and I don't have any good example of the cases in which you really need to use non-linear regression.HCISTATS:CA
Let's say you asked the participants questions about what they expect for computers depending on the OS.You prepared four descriptions: Software: There are many available software packages; Design: The aesthetics is better; Flexibility: This OS is the most customizable; and Price: This OS is most affordable. You asked the participants which OS each description is associated with best.HCISTATS:CHISQUARE
A Chi-square test is a common test for nominal (categorical) data. One application of a Chi-square test is a test for independence. In this case, the null hypothesis is that the occurrence of the outcomes for the two groups is equal. For example, you have two user groups ( e.g.,HCISTATS:ANOVA
Introduction. Analysis of Variance (ANOVA) is one statistical test commonly used in HCI research. Although it says “analysis of variance,” and ANOVA is a method to compare multiple linear models, a very common way to use an ANOVA test is to test the difference in means among more than two groups. So, the intuition is a t test which 2016HCI:PAPERASSIGNMENT Please post your paper preferences in this thread. Choose at least five papers from the reading list. Use the following template for your post. If you do not name your preference, I will pick up a paper foryou.
KOJI YATANI, PH.D.
If you want a high resolution version of these videos (MPEG-1 format), please drop an email to me (koji_at_dgp.toronto.edu).HCISTATS:PCA
From the second table (loadings), PCA found four new variables which can explain the same information as the original four variables (Price, Software, Aesthetics, and Brand), which are Comp.1 to Comp.4.HCISTATS:FA
Factor Analysis is another powerful tool to understand what your data mean particularly when you have many variables. What Factor Analysis does is to try to find hidden variables which explain the behavior of your observed variables. Our interests here also lie in reducing the number of variables. So, we hope that we can find a smaller number HCISTATS:POWERANALYSIS Probably, the most important way to use power analysis is to estimate a sample size to get the desired alpha and power. As explained in the section above, as long as you have three parameters, you can calculatethe rest parameter.
HCISTATS:KRUSKALWALLIS Kruskal-Wallis is basically a non-parametric version of ANOVA.Thus, if you have the data which contain more than two groups to compare, and your data are ordinal or your data cannot assume the normality, Kruskal-Wallis is the way to go.HCISTATS:CROSSTAB
This crosstab table shows the distribution of the ownership of the two devices separated by users' ages. From this table, it looks like the age affects the ownership of the device (i.e., younger users tend to like owing Device A and older users tend to like owing DeviceKOJI YATANI, PH.D.
CURRICULUM VITAE Koji Yatani, Ph.D. December, 2016 PERSONAL DATA Affiliation The University of Tokyo Title Associate Professor E-mailkoji@iis-lab.org
HCISTATS:RTIPS
In this page, I put some commands/ways that I found useful for analyzing your data more quickly and effectively. If you are a beginner of R, you should take a look at the intro pdf provided by R project first. There are many online materials for R, so you should doonline search.
2016HCI:PAPERASSIGNMENT Please post your paper preferences in this thread. Choose at least five papers from the reading list. Use the following template for your post. If you do not name your preference, I will pick up a paper foryou.
ADVANCED TOPICS IN HCI: MOBILE AND UBIQUITOUS COMPUTINGWEB VIEW Advanced Topics in HCI: Mobile and Ubiquitous Computing (Fall 2013) Assignment D Submission Form. Before filling out the form, read the instruction on the course webpage carefully.Skip to content
INTERACTIVE INTELLIGENT SYSTEMS LABORATORY The University of Tokyo INTERACTIVE INTELLIGENT SYSTEMS LABORATORY* IIS Lab
* Research
* Publications
* Members
* What’s up?
* Contact Us
* Help Us
* Join Us!
検索… __
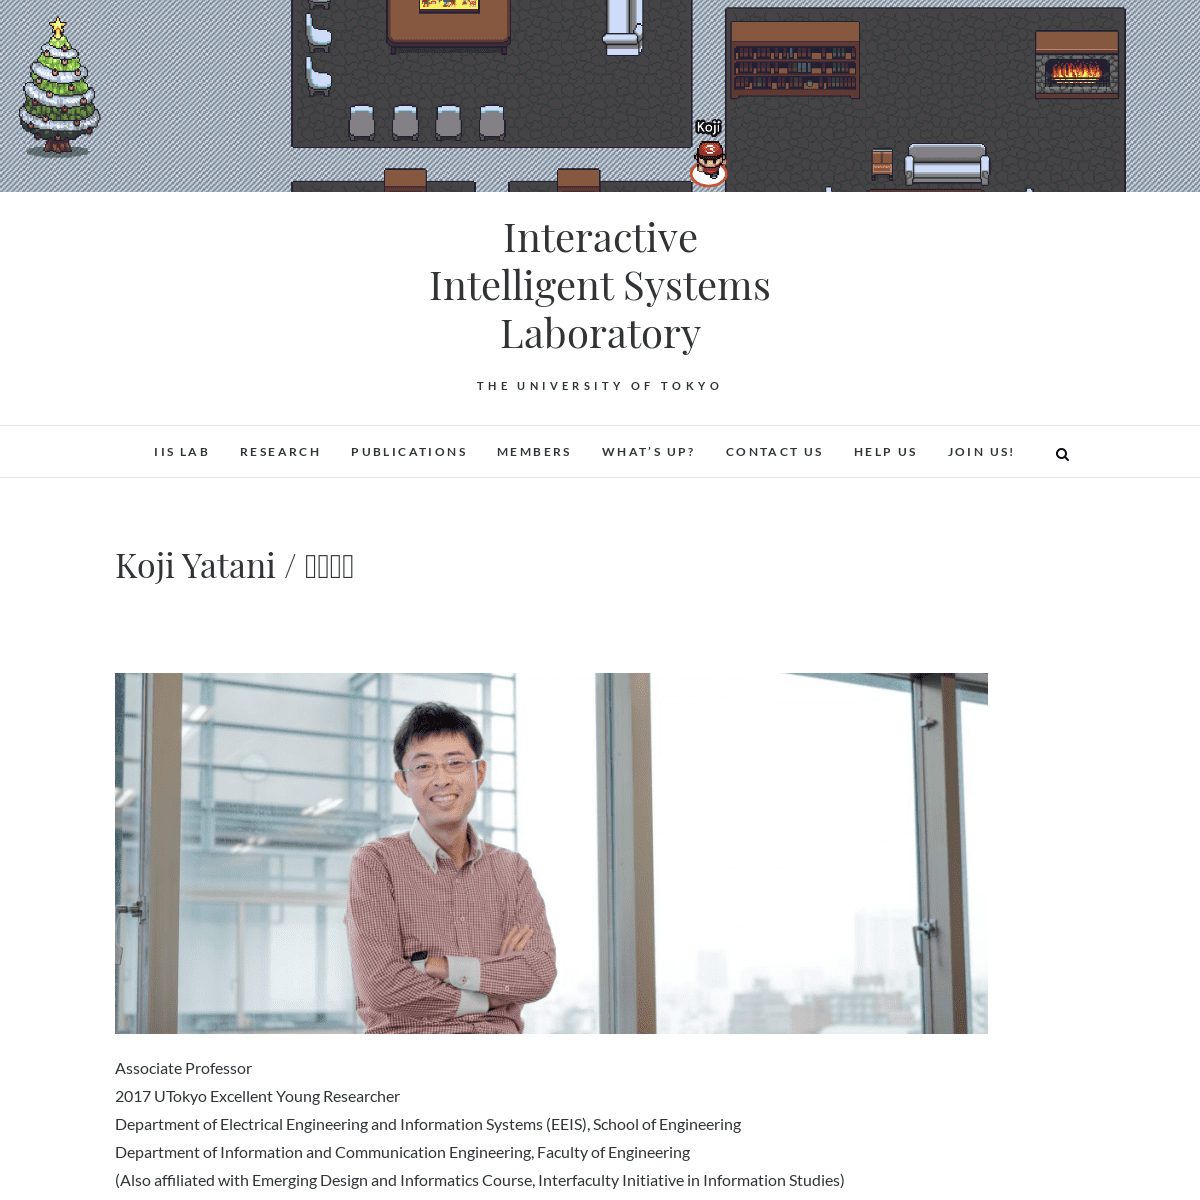
KOJI YATANI / 矢谷浩司Associate Professor
2017 UTokyo Excellent Young Researcher Department of Electrical Engineering and Information Systems (EEIS), School of Engineering Department of Information and Communication Engineering, Faculty ofEngineering
(Also affiliated with Emerging Design and Informatics Course, Interfaculty Initiative in Information Studies) The University of Tokyo 東京大学大学院工学系研究科電気系工学専攻 東京大学工学部電子情報工学科 (東京大学大学院学際情報学府 先端表現情報学コース 兼担)准教授
平成29年度東京大学卓越研究員 ------------------------- * For prospective members / IIS Labにご興味のある方へ * Statistical methods for HCI research / HCI研究向けの統計手法 * My teaching / 私が担当している授業 * Koji’s paper reading method / 矢谷流論文の読み方 * IIS Lab Research Reality Check * For students who ask me for letters / 推薦状依頼に関して ------------------------- ABOUT MYSELF / 自己紹介 My research interests lie in Human-Computer Interaction (HCI) and ubiquitous computing. More specifically, my current research focuses on novel applications over emerging information infrastructure, such as AI and IoT systems. In particular, my research emphasizes on development and evaluations of IoT applications with novel sensing technology, productivity/creativity support, creative use of AI technology for interactive systems, and usable security. I was the recipient of RIEC Award (2019), IPSJ/ACM Award for Early Career Contributions to Global Research (2020), Japan ACM SIGCHI Local Chapter Distinguished Young Researcher Award (2021), and Funai Academic Award (2021). For academic services, I am currently the ACM UbiComp Steering Committee Chair, a Papers co-chair for CHI 2022, and an Associate Editor for ACM Transactions on Computer-Human Interaction(TOCHI).
私の研究分野は,ヒューマン・コンピュータ・インタラクション(Human-ComputerInteraction;
HCI)とユビキタスコンピューティングです.現在は人工知能やIoTシステムなどにおける新しいアプリケーションを研究の重点領域としています.具体的には,新しいセンシング技術を活用したIoTアプリケーション,生産性・創造性支援システム,インタラクティブシステムに向けた創造的なAI技術の活用手法,使いやすいセキュリティ技術(ユーザブルセキュリティ)を研究しています.これらの研究成果によりRIEC Award(2019年)を,IPSJ/ACM Award for Early Career Contributions to Global Research(2020年),Japan ACM SIGCHI Local Chapter優秀若手研究者賞(2021年),船井学術賞(2021年)を受賞しています.学術的な活動では,現在ACM UbiCompの運営委員会委員長,CHI 2022 共同プログラム委員長,ACM Transactions on Computer-Human Interaction (TOCHI)の編集委員を務めております.CONTACT / 連絡先
Office: Faculty of Engineering Building 2, 7-3-1, Hongo, Bunkyo-ku,Tokyo, JAPAN.
E-mail: “at” iis-lab.org オフィス: 東京都文京区本郷7-3-1 工学部2号館 メールアドレス: “at” iis-lab.orgBIOGRAPHY / 略歴
Dr. Koji Yatani (http://yatani.jp) is an Associate Professor and 2017 UTokyo Excellent Young Researcher in Department of Electrical Engineering and Information Systems (EEIS), School of Engineering at The University of Tokyo (Department of Information and Communication Engineering for undergrads), where he leads Interactive Intelligent Systems Laboratory (https://iis-lab.org). He is also affiliated with Emerging Design and Informatics Course, Interfaculty Initiative in Information Studies. His research emphasizes on development and evaluations of IoT applications with novel sensing technology, productivity/creativity support, creative use of AI technology for interactive systems, and usable security. He also extends his research interests to a broader range of topics in HCI, including mobile interaction techniques, quantitative and quantitative studies for understanding users, and assistive technologies. Dr. Koji Yatani received his B.Eng. and M.Sci. from University of Tokyo in 2003 and 2005, respectively, and his Ph.D. in Computer Science from University of Toronto in 2011. He was under the supervision by Prof. Khai N. Truong at Dynamic Graphics Project. On November 2011, he joined HCI group at Microsoft Research Asia in Beijing, China. On October 2013, he had an appointment of a Visiting Associate Professor in Graduate School of Information Science and Technology, at The University of Tokyo. He then joined The University of Tokyo as a full-time Associate Professor on August 2014. Dr. Koji Yatani was the recipient of several important awards. He received RIEC Award (2019); IPSJ/ACM Award for Early Career Contributions to Global Research (2020); Japan ACM SIGCHI Local Chapter Distinguished Young Researcher Award (2021); and Funai Academic Award (2021). He also received 2 Best Paper awards at CHI (2011 and 2016) as well as 3 Honorable Mention Awards at CHI (2014, 2020) and 2 at MobileHCI (2014). Dr. Koji Yatani served as a founding editor for Proceedings of ACM Interactive, Mobile, Wearable and Ubiquitous Technology (2016–2020), a Program co-Chair for UbiComp 2015, and a subcommittee co-chair for CHI 2019 and 2020. He also served as a program committee and/or conference committee on major international conferences in the field of HCI, Ubiquitous computing and Haptics, including CHI, UbiComp, UIST, and MobiSys. He currently serves as the Steering Committee chair for UbiComp, a Papers co-chair for CHI 2022, an Associate Editor for ACM Transactions on Computer-Human Interaction (TOCHI), an Editor for Foundations and Trends in Human-Computer Interaction, and a Vice chair for Japan ACM SIGCHI Chapter. 2014年8月より東京大学大学院工学系研究科電気系工学専攻(工学部電子情報工学科)准教授.2016年4月より同大学大学院学際情報学府先端表現情報学コース兼担.平成29年度東京大学卓越研究員に選出.同大学にてインタラクティブ・インテリジェント・システ� ラボ(https://iis-lab.org)を率いる.新しいセンシング技術を活用したIoTアプリケーション,生産性・創造性支援システム,インタラクティブシステムに向けた創造的なAI技術の活用手法,ユーザブルセキュリティを重点的研究課題としながら,ヒューマン・コンピュータ・インタラクション分野の幅広い研究に従事. 2003年,2005年に東京大学よりそれぞれ学士号(工学),修士号(科学)を取得.2011年にカナダ,トロント大学より博士号(コンピュータ科学)を取得.2011年11月から2014年7月までMicrosoftResearch Asia,HCI
groupに勤務.また,2013年10月から2014年7月まで東京大学大学院情報理工学系研究科にて,客員准教授も務めた. 2019年,電気情報通信分野の学術研究の発展に顕著な貢献があり,将来にわたり,当該分野の発展に寄与することが期待される優秀な若手研究者に与えられるRIEC Award受賞.2020年,情報学の分野において,国際的な研究による成果をあげ,今後の発展および国際的な活躍が期待される若手研究者に与えられるIPSJ/ACM Award for Early Career Contributions to Global Research受賞.2021年,優れた研究業績を有するのみならず、ヒューマンコンピュータインタラクション分野の発展のために貢献し、本分野を先導する若手研究者に与えられるJapanACM SIGCHI Local
Chapter優秀若手研究者賞受賞.同年,情報科学,情報技術分野を中心に広く理工系分野において,顕著な研究業績のあった若手研究者に与えられる船井学術賞を受賞. 学会においては,ヒューマン・コンピュータ・インタラクション分野において最高峰の国際会議である,ACMCHIにてBest Paper
Awardを2011年と2016年に受賞.また,2014年に2件,2020年に1件のHonorable Mention Awardを同会議にて受賞.また2014年のACM MobileHCIにおいて2件のHonorable Mention Awardを受賞. ヒューマン・コンピュータ・インタラクション分野の学術界に幅広く貢献し,ACM UbiComp (2015)では共同プログラム委員長,Proceedings of ACM Interactive, Mobile, Wearable and Ubiquitous Technologyにおいて創設時からのエディター (2016–2020),ACM CHI (2019, 2020)ではプログラム・サブコミッティ委員長(CHIの特定分野内でのプログラム委員会の構成,論文査読を司る役割)を務めた他,ACM CHI,ACM UbiComp,ACM UIST,ACM MobiSysなど,HCIやユビキタス・コンピューティングにおける主要な国際会議にてプログラム委員や会議運営委員を務めた.現在はUbiCompの運営委員会委員長,CHI 2022 共同プログラム委員長(Papers co-chair),ACM Transactions on Computer-Human Interaction (TOCHI)において編集委員,Foundations and Trends in Human-Computer Interactionにおいてエディタ,Japan ACM SIGCHI ChapterにおいてVice chairも務める. AWARD & RECOGNITION / 受賞等 * 2021年: 船井学術賞 (Funai Academic Award) * 2021年: Japan ACM SIGCHI Local Chapter Distinguished YoungResearcher Award
(優秀若手研究者賞) * 2020年: CHI Honorable Mention Award 1件 * 2020年: IPSJ/ACM Award for Early Career Contributions to GlobalResearch
(People of ACM articleon this
award)
* 2019年: RIEC Award * 2017年: 東京大学卓越研究員 / UTokyo Excellent YoungResearcher
* 2016年: CHI Best Paper Award 1件 * 2014年: MobileHCI Honorable Mention Award 2件 * 2013年: CHI Honorable Mention Award 2件 * 2011年: CHI Best Paper Award 1件 * 2005年: 日本学術振興会DC1 * 2003年: ドコモ奨学金 PROFESSIONAL ACTIVITIES / 学会活動 * Journal editor / 論文誌エディタ * Proceedings of ACM Interactive, Mobile, Wearable and Ubiquitous Technology (IMWUT; 2016 — 2020) * Foundations and Trends in Human-Computer Interaction (FnT HCI,2020 –)
* IEEE Pervasive Computing, Special Issue on Growing Up with Pervasive Computing (2019, as a Guest co-Editor) * Journal associate editor / 論文誌編集委員 * ACM Transaction of Computer-Human Interaction (TOCHI; 2017 –) * 情報処理学会論文誌(特集号) * Program/Papers co-chair / プログラム委員長* CHI (2022)
* UbiComp (2015)
* CHI subcommittee co-chair / CHIサブコミッティ委員長 * Engineering Interactive Systems and Technology (2019, 2020) * Program committee / プログラム委員* AH (2013)
* ASSETS (2017, 2018, 2019, 2021)* CHI (2013, 2017)
* Mobiquitous (2015)* MobiSys (2014)
* MUM (2020)
* PX (2020)
* Ubicomp (2012 — 2014) * UIST (2013, 2015, 2017, 2018) * World Haptics Conference (2013)* WWW (2018)
* インタラクション(2018) * Conference steering committee / 運営委員 * Japan ACM SIGCHI Chapter (Vice chair; 2016 –) * ACM UbiComp conference (2015 — 2021, as the steering committee chair 2019 — 2021) * 情報処理学会UBI研究会 (2015 — 2018) * 情報処理学会HCI研究会 (2020 –) * Conference committee / 会議運営委員 * Sponsorship Chair: CHI (2021), UIST (2016), UbiComp (2017, 2018) * Doctoral Consortium Chair: CHI (2019, 2020), ISS (2018) * Journals Chair: CHI (2021) * Video Chair: Ubicomp (2013) * Student Innovation Contest Chair: UIST (2020) * Mentoring Chair: ITS (2012) * Journal reviewer / 論文誌査読者 * ACM Transactions on Interactive Intelligent Systems * ACM Transactions on Computer-Human Interaction * Applied Ergonomics * Human–Computer Interaction (Taylor & Francis) * IEEE Transactions on Haptics * IEEE Transactions on Mobile Computing * IEEE Transactions on Multimedia * IEEE Transactions on Sensors * IEICE Transactions on Fundamentals of Electronics, Communications and Computer Sciences * IEICE Transactions on Information and Systems * International Journal of Human-Computer Studies (Elsevier) * Pervasive and Mobile Computing (Elsevier) * Proceedings of ACM Interactive, Mobile, Wearable, and UbiquitousTechnology (IMWUT)
* 情報処理学会論文誌 * ヒューマンインターフェース論文誌 * Conference reviewer / 会議査読者 * ACE, APCHI, APSIPA Annual Summit and Conference, CHI, CSCW, DIS, GI, Internet of Things Conference, ITS (formally TableTop), IUI, MobileHCI, NordiCHI, Pervasive, TEI, UbiComp, UIST, SIGGRAPH Asia,3DUI
* Funding reviewer / 研究費査読者 * Fostering Responsible Research Practices by The Netherlands Organisation for Health Research and Development * Ontario Research Fund * Philippine-California Advanced Research Institutes Project * Veni grant program (Netherlands Organization for ScientificResearch)
INVITED TALKS & PANELS / 招待講演・パネリスト * “Enabler” is my middle name: Creating enabling technology and contributing to enabling communities. Award talk at RIEC International Symposium on Human-Computer Interaction, January 2021. * Career development talk and panel. CSCW Asia Winter School 2020,December 2020.
* Helping adolescent SNS users overcome privacy and security threats. Invited talk at the RIEC International Symposium on Human-Computer Interaction. January 2020. * Career development talk and panel. CSCW Asia Winter School 2019,December 2019.
*
知的作業の生産性を飛躍させるヒューマンコンピュータインタラクション技術の設計と評価.RIEC Award授賞式.2019年12月. * Interactive Technology for Personal Healthcare Applications. Keynote talk at WristSense 2019 workshop. March 2019. * Sensing Technology and Interface for Personal Healthcare. Invited talk at the third ACM SIGCHI Asian Symposium. December 2018. * Reshaping Security Experience. Invited talk at University of British Columbia, Designing for People project. June 2018. * A Ph.D. – What does it take? Invited lecture at Kochi Institute of Technology, December 2016. * Interactive technology for creative, productive and healthy life. Invited talk at the first ACM SIGCHI Asian Symposium. December 2016. * Interactive technology for creative, productive and healthy life. Invited talk at NTU-UTokyo joint conference, National Taiwan University. November 2016. * HCI for productivity and creativity. Invited talk at Post-CHI 2015 Workshop, KAIST. April 2015. * Why, What and How to Evaluate?: Another IR Evaluation Direction with Qualitative Approaches. Invited panelist at International Workshop on Evaluating Information Access, Graduate School of Information Science and Technology, December 2014. * Interactive Productivity Support: For the Better Get Things Done. Invited lecture at Advanced Topics in HCI (taught by Prof. Jun Rekimoto), Graduate School of Interdisciplinary Information Studies, University of Tokyo. October 2014. * Productivity, Creativity, Diversity. Invited lecture at Media Informatics (taught by Prof. Takeo Igarashi), Graduate School of Information Science and Technology, University of Tokyo. June 2013. * How Research can Change the World: the Impact of Kinect. Invited lecture at Department of Electrical Engineering and Information Systems, University of Tokyo. June 2013. * Social Computing: New Relationship and Interaction between Human and Computers. Invited talk at Social Computing Symposium (a Japanese domestic conference). June 2013. * My Lessons Learned from Research: Things You should Know and Do before Getting Ph.D. Invited lecture at Department of Electrical Engineering and Information Systems, University of Tokyo. December2012.
* A Ph.D. – What Does It Take? Invited talk at Department of Computer Science and Information Engineering, National Taiwan University. November 2012. * Sensing Technologies and Interaction. Invited seminar at Nikkei Electronics seminar. November 2012. * Kinect @ MSR. Talk in the Kinect4Windows workshop at Interaction 2012 (a Japanese domestic conference). March 2012. * The Fun of Failure: Lessons Learned from Designing Interactive Systems. Invited talk at the VRSJ Annual Conference (a Japanese domestic conference). September 2011. * Review Spotlight: A User Interface for Summarizing Online Reviews. Invite talk at CS4HS Summer Program for HS Teachers, University ofToronto. July 2011.
* Cutting Edge Research: Input Devices. Participated as a speaker and panelist at the INplay conference. May 2011. * Interactive Systems with User-generated Data and Content. Invited talk at DCS Symposium on Trends in Computing, University of Toronto.May 2010.
INVITED ARTICLES / 寄稿 * 先生,質問です! 情報処理学会学会誌2019年8月号. * AI研究が拓く新しい産学連携 〜非AI研究者の視点から〜 化学工業,2018年8月. * 選択する自由,選択する責任 -大学教員になって感じたこと- 情報処理学会誌,2017年5月. * SIGGRAPH Asia 参加報告,VR学会論文誌,2016年3月 (ウェブ掲載版はこちら ). * A Ph.D. – What does it take? 人工知能学会誌,2014年7月. MEDIA EXPOSURE / メディア・記事 * People of ACM, 2020/11/5.*
一番最初に失敗する集団!?人間とテクノロジーの新しい関係を追求する研究とは.Hey!Labo,2020/4/2.
*
東大の矢谷研究室とAI連携。調査・記事作成など共同研究。次世代メディア追求.日本海事新聞社,2019/9/6 デイリー版1面.*
情報を用いて指紋認証を拡張するシステムの研究.セコム科学技術振興財団 挑戦的研究助成 研究者インタビュー.2019/9/6*
東京大学・矢谷浩司氏が展望。手軽に“自分だけのハイライト”を作れる時代へ.パ・リーグ インサイト.2019/8/21.*
最新テクノロジーと実社会をつなぐ「応用科学」の専門家 –技術アドバイザー・矢谷 浩司,2019年6月.*
人間はもう超えた! ファッション向けAIの進化.論座2019/5/27.
*
びっくり新技術 価格や色を音声に,アプリ開発.東京新聞(2019/4/22朝刊),中日新聞(2019/4/23夕刊).*
人間とコンピュータの最適な関係を実現する〜矢谷浩司・東京大学准教授,Top Researchers,2019年4月. * 百貨店で買い物、声や振動で案内 視覚障害者向けアプリ,朝日新聞デジタル2019年3月7日.*
やり方が分かっていたらそれは研究ではない―工学部・矢谷浩司准教授,キミの東大,2019年3月.*
経営ひと言「失敗こそ仕事」,日刊工業新聞2019年2月15日版.*
衝動買いにつながるしぐさ、東大などがデータ収集,日刊工業新聞2019年1月31日版. * 視覚障がい者の買い物、RFIDで支援 東大がスマホアプリ開発,日刊工業新聞2019年1月28日版. * 東京大学卓越研究員,2018年12月. * Stockmark社との共同事業,2018年2月.(AI Alchemist)
* TechCrunch
* PR times
* AI Now
* NISSEN Digital Hub * SAKIGAKE,2017年7月.*
* 駒場祭アプリ → ONE THOUGHT ON “KOJI YATANI / 矢谷浩司”*
ピンバック:
<記事タイトル>|AI/人工知能のビジネス活用発信メディア【NISSENデジタルハブ】 現在コメントは受け付けていません。 � 2021 Interactive Intelligent Systems Laboratory__
Details
5