1
More Annotations


4


4
Favourite Annotations


5


4
Text
DRAX ELECTRIC INSIGHTS ELECTRIC INSIGHTS Take a closer look at the supply, demand, price and environmental impact of Britain’s electricity. Electricity demand;
Electricity price
ELECTRIC INSIGHTS
Capacity and production statistics. Electricity production from gas rose 20% from this time last year, driven by lower wind output and continued nuclear outages. JANUARY TO MARCH 2021 ELECTRIC INSIGHTS QUARTERLY Drax Electric Insights Quarterly – Q1 2021 4 Jan 13th Jan 8th February March £/MWh 0 200 400 600 800 1,000 January Jan 6th Peak Daily average Electricity Market Notice (EMN) CAPACITY AND PRODUCTION STATISTICS Other sources give different values because of the types of plant they consider. For example, BEIS Energy Trends records an additional 0.7 GW of hydro, 0.6 GW of biomass and 3 GW of waste-to-energy plants. These plants and their output are not visible to the electricity transmission system and so cannot be reported on here. We include an estimate of the installed capacity of smaller BRITAIN’S TRANSITION FROM COAL TO BIOMASS TO BECCS These units will still operate in the capacity market until they are fully decommissioned in 2022, meaning they could be called upon to provide peak capacity at times of system stress. Data from Ember’s Global Electricity Review Bioenergy with carbon capture and storage R Green and I Staffell, 2021. The contribution of taxes, subsidies and regulations to British electricity RECORD WIND OUTPUT AND CURTAILMENT Between 2015 and 2019, curtailment costs rose in line with wind output from £90 to £145 million per year. This cost doubled in 2020 though, as National Grid ESO faced a bill of £282 million – around £10 per household. Put another way, curtailment costs added £4 to each MWh of wind energy generated. While this pushes up the whole-system RENEWABLES OVERTAKE FOSSIL FUELS In 2020 their roles reversed, and renewables overtook fossil fuels for the first time to become Britain’s biggest source of electricity over the whole year. Together wind, solar, hydro and biomass provided 104 TWh of electricity, or 39% of all consumed. The pace of change has been dramatic. Renewable output has increased ten-fold since 2010 COLD WEATHER AND TIGHT MARGINS Dr Iain Staffell, Professor Richard Green, Professor Tim Green and Dr Malte Jansen — Imperial College London. The Texas blackout dominated the newspaper headlines in February. WHEN THE WIND GOES, GAS FILLS IN THE GAP Dr Malte Jansen, Dr Iain Staffell, Professor Richard Green and Professor Tim Green — Imperial College London. At the start of March Britain experienced its longest spell of low wind output in more thana
WHAT TO DO WHEN THE WIND DOESN’T BLOW? by Dr Iain Staffell – Imperial College London Some call it intermittency, some call it variability; the simple fact is we cannotcontrol the wind.
DRAX ELECTRIC INSIGHTS ELECTRIC INSIGHTS Take a closer look at the supply, demand, price and environmental impact of Britain’s electricity. Electricity demand;Electricity price
ELECTRIC INSIGHTS
Capacity and production statistics. Electricity production from gas rose 20% from this time last year, driven by lower wind output and continued nuclear outages. JANUARY TO MARCH 2021 ELECTRIC INSIGHTS QUARTERLY Drax Electric Insights Quarterly – Q1 2021 4 Jan 13th Jan 8th February March £/MWh 0 200 400 600 800 1,000 January Jan 6th Peak Daily average Electricity Market Notice (EMN) CAPACITY AND PRODUCTION STATISTICS Other sources give different values because of the types of plant they consider. For example, BEIS Energy Trends records an additional 0.7 GW of hydro, 0.6 GW of biomass and 3 GW of waste-to-energy plants. These plants and their output are not visible to the electricity transmission system and so cannot be reported on here. We include an estimate of the installed capacity of smaller BRITAIN’S TRANSITION FROM COAL TO BIOMASS TO BECCS These units will still operate in the capacity market until they are fully decommissioned in 2022, meaning they could be called upon to provide peak capacity at times of system stress. Data from Ember’s Global Electricity Review Bioenergy with carbon capture and storage R Green and I Staffell, 2021. The contribution of taxes, subsidies and regulations to British electricity RECORD WIND OUTPUT AND CURTAILMENT Between 2015 and 2019, curtailment costs rose in line with wind output from £90 to £145 million per year. This cost doubled in 2020 though, as National Grid ESO faced a bill of £282 million – around £10 per household. Put another way, curtailment costs added £4 to each MWh of wind energy generated. While this pushes up the whole-system RENEWABLES OVERTAKE FOSSIL FUELS In 2020 their roles reversed, and renewables overtook fossil fuels for the first time to become Britain’s biggest source of electricity over the whole year. Together wind, solar, hydro and biomass provided 104 TWh of electricity, or 39% of all consumed. The pace of change has been dramatic. Renewable output has increased ten-fold since 2010 COLD WEATHER AND TIGHT MARGINS Dr Iain Staffell, Professor Richard Green, Professor Tim Green and Dr Malte Jansen — Imperial College London. The Texas blackout dominated the newspaper headlines in February. WHEN THE WIND GOES, GAS FILLS IN THE GAP Dr Malte Jansen, Dr Iain Staffell, Professor Richard Green and Professor Tim Green — Imperial College London. At the start of March Britain experienced its longest spell of low wind output in more thana
WHAT TO DO WHEN THE WIND DOESN’T BLOW? by Dr Iain Staffell – Imperial College London Some call it intermittency, some call it variability; the simple fact is we cannotcontrol the wind.
HEADLINES | Q1 2021 QUARTERLY REPORT | ELECTRIC INSIGHTS Dr Iain Staffell, Professor Richard Green, Professor Tim Green and Dr Malte Jansen — Imperial College London. The start of 2021 saw unusually cold weather coupled with plant outages, which created very tight supply margins throughout January.IFA2 GOES ONLINE
Dr Iain Staffell, Professor Richard Green, Professor Tim Green and Dr Malte Jansen — Imperial College London. A new power link between the UK and France went online in January, meaning Britain’s interconnector capacity has doubled over the last decade to 6 GW. HEADLINES | Q4 2020 QUARTERLY REPORT | ELECTRIC INSIGHTS 2020 was a record-breaking year for the power system, in many ways because of the coronavirus pandemic. Lockdowns reduced activity, so electricity demand fell by 6%, the largest ever recorded in the national grid’s 100 year history. Fossil fuels took the brunt of this fall, and their generation fell below 100 TWh for the first timesince 1960.
WHEN THE WIND GOES, GAS FILLS IN THE GAP Dr Malte Jansen, Dr Iain Staffell, Professor Richard Green and Professor Tim Green — Imperial College London. At the start of March Britain experienced its longest spell of low wind output in more thana
POWER SYSTEM RECORDS 2020 was yet another year of extremes, with the power system moving further into new territory. Just as in 2019, all clean electricity sources broke their previous annual production records. Wind, solar and biomass reached all-time highs in 2020, while nuclear fell to its lowest output in over a decade. 2020 also saw the lowest electricity CAPACITY AND PRODUCTION STATISTICS This pushed fossil fuel output down by 12% compared to Q4 in 2019. The capacity factor for gas stations remained below 50% for the seventh quarter running. Across 2020, the capacity factor of gas stations fell below 40%. Coal output fell by more than half compared to this time last year as a slew of retirements through 2020 brought took two METHODOLOGY AND SOURCES Electric Insights was established by Drax Group to help inform and enlighten the debate on Britain’s electricity. It is an independent and transparent analysis of supply, demand, price and environmental impacts, made entirely using publicly available data. Drax Group owns and operates the UK’s largest power station, supplying 6% of the FLEXIBLE FOSSIL REWARDED WITH PREMIUM PRICES During 2020, fossil fuelled power stations earned 25% more than wind and solar farms per unit of output, and this gap has quadrupled in the last two years. During 2020, the average power price was £36/MWh, its lowest in over a decade as fuel prices fell and lockdowns suppressed demand. But not all technologies earn this average, as power THE SAUDI ARABIA OF WIND POWER? by Phil McNally, Energy UK. On October 6 th, the Prime Minister reaffirmed strong commitments to offshore wind.. While this could cement the UK’s world leading position, it alone does not make us “the Saudi Arabia of wind power” as was widely reported. THE FUTURE OF BRITAIN’S INTERCONNECTORS This future is unclear as participation is based on membership of the European single market, and no specific trade rules have been announced for the post-Brexit energy sector. 1. Leaving the IEM would revert us back to less efficient interconnector trading. Uneconomic trades (buying dear, selling cheap) could occur up to 20% of the time2
DRAX ELECTRIC INSIGHTS ELECTRIC INSIGHTS Take a closer look at the supply, demand, price and environmental impact of Britain’s electricity. Electricity demand;Electricity price
ELECTRIC INSIGHTS
Capacity and production statistics. Electricity production from gas rose 20% from this time last year, driven by lower wind output and continued nuclear outages. JANUARY TO MARCH 2021 ELECTRIC INSIGHTS QUARTERLY Drax Electric Insights Quarterly – Q1 2021 4 Jan 13th Jan 8th February March £/MWh 0 200 400 600 800 1,000 January Jan 6th Peak Daily average Electricity Market Notice (EMN) CAPACITY AND PRODUCTION STATISTICS Other sources give different values because of the types of plant they consider. For example, BEIS Energy Trends records an additional 0.7 GW of hydro, 0.6 GW of biomass and 3 GW of waste-to-energy plants. These plants and their output are not visible to the electricity transmission system and so cannot be reported on here. We include an estimate of the installed capacity of smaller BRITAIN’S TRANSITION FROM COAL TO BIOMASS TO BECCS These units will still operate in the capacity market until they are fully decommissioned in 2022, meaning they could be called upon to provide peak capacity at times of system stress. Data from Ember’s Global Electricity Review Bioenergy with carbon capture and storage R Green and I Staffell, 2021. The contribution of taxes, subsidies and regulations to British electricity RECORD WIND OUTPUT AND CURTAILMENT Between 2015 and 2019, curtailment costs rose in line with wind output from £90 to £145 million per year. This cost doubled in 2020 though, as National Grid ESO faced a bill of £282 million – around £10 per household. Put another way, curtailment costs added £4 to each MWh of wind energy generated. While this pushes up the whole-system RENEWABLES OVERTAKE FOSSIL FUELS In 2020 their roles reversed, and renewables overtook fossil fuels for the first time to become Britain’s biggest source of electricity over the whole year. Together wind, solar, hydro and biomass provided 104 TWh of electricity, or 39% of all consumed. The pace of change has been dramatic. Renewable output has increased ten-fold since 2010 COLD WEATHER AND TIGHT MARGINS Dr Iain Staffell, Professor Richard Green, Professor Tim Green and Dr Malte Jansen — Imperial College London. The Texas blackout dominated the newspaper headlines in February. WHEN THE WIND GOES, GAS FILLS IN THE GAP Dr Malte Jansen, Dr Iain Staffell, Professor Richard Green and Professor Tim Green — Imperial College London. At the start of March Britain experienced its longest spell of low wind output in more thana
WHAT TO DO WHEN THE WIND DOESN’T BLOW? by Dr Iain Staffell – Imperial College London Some call it intermittency, some call it variability; the simple fact is we cannotcontrol the wind.
HEADLINES | Q1 2021 QUARTERLY REPORT | ELECTRIC INSIGHTS Dr Iain Staffell, Professor Richard Green, Professor Tim Green and Dr Malte Jansen — Imperial College London. The start of 2021 saw unusually cold weather coupled with plant outages, which created very tight supply margins throughout January.IFA2 GOES ONLINE
Dr Iain Staffell, Professor Richard Green, Professor Tim Green and Dr Malte Jansen — Imperial College London. A new power link between the UK and France went online in January, meaning Britain’s interconnector capacity has doubled over the last decade to 6 GW. HEADLINES | Q4 2020 QUARTERLY REPORT | ELECTRIC INSIGHTS 2020 was a record-breaking year for the power system, in many ways because of the coronavirus pandemic. Lockdowns reduced activity, so electricity demand fell by 6%, the largest ever recorded in the national grid’s 100 year history. Fossil fuels took the brunt of this fall, and their generation fell below 100 TWh for the first timesince 1960.
WHEN THE WIND GOES, GAS FILLS IN THE GAP Dr Malte Jansen, Dr Iain Staffell, Professor Richard Green and Professor Tim Green — Imperial College London. At the start of March Britain experienced its longest spell of low wind output in more thana
POWER SYSTEM RECORDS 2020 was yet another year of extremes, with the power system moving further into new territory. Just as in 2019, all clean electricity sources broke their previous annual production records. Wind, solar and biomass reached all-time highs in 2020, while nuclear fell to its lowest output in over a decade. 2020 also saw the lowest electricity CAPACITY AND PRODUCTION STATISTICS This pushed fossil fuel output down by 12% compared to Q4 in 2019. The capacity factor for gas stations remained below 50% for the seventh quarter running. Across 2020, the capacity factor of gas stations fell below 40%. Coal output fell by more than half compared to this time last year as a slew of retirements through 2020 brought took two METHODOLOGY AND SOURCES Electric Insights was established by Drax Group to help inform and enlighten the debate on Britain’s electricity. It is an independent and transparent analysis of supply, demand, price and environmental impacts, made entirely using publicly available data. Drax Group owns and operates the UK’s largest power station, supplying 6% of the FLEXIBLE FOSSIL REWARDED WITH PREMIUM PRICES During 2020, fossil fuelled power stations earned 25% more than wind and solar farms per unit of output, and this gap has quadrupled in the last two years. During 2020, the average power price was £36/MWh, its lowest in over a decade as fuel prices fell and lockdowns suppressed demand. But not all technologies earn this average, as power THE SAUDI ARABIA OF WIND POWER? by Phil McNally, Energy UK. On October 6 th, the Prime Minister reaffirmed strong commitments to offshore wind.. While this could cement the UK’s world leading position, it alone does not make us “the Saudi Arabia of wind power” as was widely reported. THE FUTURE OF BRITAIN’S INTERCONNECTORS This future is unclear as participation is based on membership of the European single market, and no specific trade rules have been announced for the post-Brexit energy sector. 1. Leaving the IEM would revert us back to less efficient interconnector trading. Uneconomic trades (buying dear, selling cheap) could occur up to 20% of the time2
DRAX ELECTRIC INSIGHTS ELECTRIC INSIGHTS Take a closer look at the supply, demand, price and environmental impact of Britain’s electricity. Electricity demand;Electricity price
HEADLINES | Q1 2021 QUARTERLY REPORT | ELECTRIC INSIGHTS Dr Iain Staffell, Professor Richard Green, Professor Tim Green and Dr Malte Jansen — Imperial College London. The start of 2021 saw unusually cold weather coupled with plant outages, which created very tight supply margins throughout January.ELECTRIC INSIGHTS
Capacity and production statistics. Electricity production from gas rose 20% from this time last year, driven by lower wind output and continued nuclear outages. CAPACITY AND PRODUCTION STATISTICS Other sources give different values because of the types of plant they consider. For example, BEIS Energy Trends records an additional 0.7 GW of hydro, 0.6 GW of biomass and 3 GW of waste-to-energy plants. These plants and their output are not visible to the electricity transmission system and so cannot be reported on here. We include an estimate of the installed capacity of smaller JANUARY TO MARCH 2021 ELECTRIC INSIGHTS QUARTERLY Drax Electric Insights Quarterly – Q1 2021 4 Jan 13th Jan 8th February March £/MWh 0 200 400 600 800 1,000 January Jan 6th Peak Daily average Electricity Market Notice (EMN) BRITAIN’S TRANSITION FROM COAL TO BIOMASS TO BECCS These units will still operate in the capacity market until they are fully decommissioned in 2022, meaning they could be called upon to provide peak capacity at times of system stress. Data from Ember’s Global Electricity Review Bioenergy with carbon capture and storage R Green and I Staffell, 2021. The contribution of taxes, subsidies and regulations to British electricity COLD WEATHER AND TIGHT MARGINS Dr Iain Staffell, Professor Richard Green, Professor Tim Green and Dr Malte Jansen — Imperial College London. The Texas blackout dominated the newspaper headlines in February. WHEN THE WIND GOES, GAS FILLS IN THE GAP Dr Malte Jansen, Dr Iain Staffell, Professor Richard Green and Professor Tim Green — Imperial College London. At the start of March Britain experienced its longest spell of low wind output in more thana
RECORD WIND OUTPUT AND CURTAILMENT Between 2015 and 2019, curtailment costs rose in line with wind output from £90 to £145 million per year. This cost doubled in 2020 though, as National Grid ESO faced a bill of £282 million – around £10 per household. Put another way, curtailment costs added £4 to each MWh of wind energy generated. While this pushes up the whole-system WHAT TO DO WHEN THE WIND DOESN’T BLOW? by Dr Iain Staffell – Imperial College London Some call it intermittency, some call it variability; the simple fact is we cannotcontrol the wind.
HEADLINES | Q1 2021 QUARTERLY REPORT | ELECTRIC INSIGHTS Dr Iain Staffell, Professor Richard Green, Professor Tim Green and Dr Malte Jansen — Imperial College London. The start of 2021 saw unusually cold weather coupled with plant outages, which created very tight supply margins throughout January. WHEN THE WIND GOES, GAS FILLS IN THE GAP Dr Malte Jansen, Dr Iain Staffell, Professor Richard Green and Professor Tim Green — Imperial College London. At the start of March Britain experienced its longest spell of low wind output in more thana
2020 IN REVIEW
Their combined share of generation grew by 5 percentage points in 2020, from 22 to 27%. Their share has grown 9-fold since 2010, and this pace needs to continue for much of the coming decade. The CCC put the share of electricity from wind and solar at 50% by 2025 and 69% by 2030. After then it will plateau, settling out around 75-85% in the2030s.
POWER SYSTEM RECORDS 2020 was yet another year of extremes, with the power system moving further into new territory. Just as in 2019, all clean electricity sources broke their previous annual production records. Wind, solar and biomass reached all-time highs in 2020, while nuclear fell to its lowest output in over a decade. 2020 also saw the lowest electricity RENEWABLES OVERTAKE FOSSIL FUELS In 2020 their roles reversed, and renewables overtook fossil fuels for the first time to become Britain’s biggest source of electricity over the whole year. Together wind, solar, hydro and biomass provided 104 TWh of electricity, or 39% of all consumed. The pace of change has been dramatic. Renewable output has increased ten-fold since 2010 HEADLINES | Q4 2019 QUARTERLY REPORT | ELECTRIC INSIGHTS In 2019, the average carbon intensity of Britain’s electricity fell below 200 g/kWh for the first time ever, ending the decade 60% lower than at the start. Renewables continued to grow and coal retreated to less than 2% of supply. However, Britain’s weather is also moving into new territory, with heat waves becoming ever-more common FLEXIBLE FOSSIL REWARDED WITH PREMIUM PRICES During 2020, fossil fuelled power stations earned 25% more than wind and solar farms per unit of output, and this gap has quadrupled in the last two years. During 2020, the average power price was £36/MWh, its lowest in over a decade as fuel prices fell and lockdowns suppressed demand. But not all technologies earn this average, as power THE SAUDI ARABIA OF WIND POWER? by Phil McNally, Energy UK. On October 6 th, the Prime Minister reaffirmed strong commitments to offshore wind.. While this could cement the UK’s world leading position, it alone does not make us “the Saudi Arabia of wind power” as was widely reported.RUNNING LOW ON GAS
On March 1st, National Grid forecast that the amount of gas in pipelines was going to fall below the normal operating range. This forced them to trigger the first ‘Gas Deficit Warning’ in eight years. This helped push the spot price of gas to 11.2 p/kWh – compared to an annual average of just 1.5 p/kWh. The price increasebrought more
THE FUTURE OF BRITAIN’S INTERCONNECTORS This future is unclear as participation is based on membership of the European single market, and no specific trade rules have been announced for the post-Brexit energy sector. 1. Leaving the IEM would revert us back to less efficient interconnector trading. Uneconomic trades (buying dear, selling cheap) could occur up to 20% of the time2
DRAX ELECTRIC INSIGHTS ELECTRIC INSIGHTS Take a closer look at the supply, demand, price and environmental impact of Britain’s electricity. Electricity demand;Electricity price
ELECTRIC INSIGHTS
Capacity and production statistics. Electricity production from gas rose 20% from this time last year, driven by lower wind output and continued nuclear outages. HEADLINES | Q1 2021 QUARTERLY REPORT | ELECTRIC INSIGHTS Dr Iain Staffell, Professor Richard Green, Professor Tim Green and Dr Malte Jansen — Imperial College London. The start of 2021 saw unusually cold weather coupled with plant outages, which created very tight supply margins throughout January. JANUARY TO MARCH 2021 ELECTRIC INSIGHTS QUARTERLY Drax Electric Insights Quarterly – Q1 2021 4 Jan 13th Jan 8th February March £/MWh 0 200 400 600 800 1,000 January Jan 6th Peak Daily average Electricity Market Notice (EMN) CAPACITY AND PRODUCTION STATISTICS Other sources give different values because of the types of plant they consider. For example, BEIS Energy Trends records an additional 0.7 GW of hydro, 0.6 GW of biomass and 3 GW of waste-to-energy plants. These plants and their output are not visible to the electricity transmission system and so cannot be reported on here. We include an estimate of the installed capacity of smaller RECORD WIND OUTPUT AND CURTAILMENT Between 2015 and 2019, curtailment costs rose in line with wind output from £90 to £145 million per year. This cost doubled in 2020 though, as National Grid ESO faced a bill of £282 million – around £10 per household. Put another way, curtailment costs added £4 to each MWh of wind energy generated. While this pushes up the whole-system COLD WEATHER AND TIGHT MARGINS Dr Iain Staffell, Professor Richard Green, Professor Tim Green and Dr Malte Jansen — Imperial College London. The Texas blackout dominated the newspaper headlines in February. WHEN THE WIND GOES, GAS FILLS IN THE GAP Dr Malte Jansen, Dr Iain Staffell, Professor Richard Green and Professor Tim Green — Imperial College London. At the start of March Britain experienced its longest spell of low wind output in more thana
BRITAIN’S TRANSITION FROM COAL TO BIOMASS TO BECCS These units will still operate in the capacity market until they are fully decommissioned in 2022, meaning they could be called upon to provide peak capacity at times of system stress. Data from Ember’s Global Electricity Review Bioenergy with carbon capture and storage R Green and I Staffell, 2021. The contribution of taxes, subsidies and regulations to British electricity WHAT TO DO WHEN THE WIND DOESN’T BLOW? by Dr Iain Staffell – Imperial College London Some call it intermittency, some call it variability; the simple fact is we cannotcontrol the wind.
HEADLINES | Q1 2021 QUARTERLY REPORT | ELECTRIC INSIGHTS Dr Iain Staffell, Professor Richard Green, Professor Tim Green and Dr Malte Jansen — Imperial College London. The start of 2021 saw unusually cold weather coupled with plant outages, which created very tight supply margins throughout January.2020 IN REVIEW
Their combined share of generation grew by 5 percentage points in 2020, from 22 to 27%. Their share has grown 9-fold since 2010, and this pace needs to continue for much of the coming decade. The CCC put the share of electricity from wind and solar at 50% by 2025 and 69% by 2030. After then it will plateau, settling out around 75-85% in the2030s.
HEADLINES | Q4 2020 QUARTERLY REPORT | ELECTRIC INSIGHTS 2020 was a record-breaking year for the power system, in many ways because of the coronavirus pandemic. Lockdowns reduced activity, so electricity demand fell by 6%, the largest ever recorded in the national grid’s 100 year history. Fossil fuels took the brunt of this fall, and their generation fell below 100 TWh for the first timesince 1960.
RENEWABLES OVERTAKE FOSSIL FUELS In 2020 their roles reversed, and renewables overtook fossil fuels for the first time to become Britain’s biggest source of electricity over the whole year. Together wind, solar, hydro and biomass provided 104 TWh of electricity, or 39% of all consumed. The pace of change has been dramatic. Renewable output has increased ten-fold since 2010 POWER SYSTEM RECORDS The annual records relate to calendar years, covering the period of 2009 to 2020. Note that Britain has no inter-seasonal electricity storage, so we only report on half-hourly and daily records. Elexon and National Grid only report the output of large pumped hydro storage plants. The operation of battery, flywheel and other storage sites is not publicly available. CAPACITY AND PRODUCTION STATISTICS This pushed fossil fuel output down by 12% compared to Q4 in 2019. The capacity factor for gas stations remained below 50% for the seventh quarter running. Across 2020, the capacity factor of gas stations fell below 40%. Coal output fell by more than half compared to this time last year as a slew of retirements through 2020 brought took two METHODOLOGY AND SOURCES Electric Insights was established by Drax Group to help inform and enlighten the debate on Britain’s electricity. It is an independent and transparent analysis of supply, demand, price and environmental impacts, made entirely using publicly available data. Drax Group owns and operates the UK’s largest power station, supplying 6% of the FLEXIBLE FOSSIL REWARDED WITH PREMIUM PRICES During 2020, fossil fuelled power stations earned 25% more than wind and solar farms per unit of output, and this gap has quadrupled in the last two years. During 2020, the average power price was £36/MWh, its lowest in over a decade as fuel prices fell and lockdowns suppressed demand. But not all technologies earn this average, as power THE COST OF STAYING IN CONTROL The actions that National Grid takes to manage the power system have typically amounted to 5% of generation costs over the last decade, but this share has quadrupled over the last two years. In the first half of 2020, the cost of these actions averaged £100 million per month. THE FUTURE OF BRITAIN’S INTERCONNECTORS This future is unclear as participation is based on membership of the European single market, and no specific trade rules have been announced for the post-Brexit energy sector. 1. Leaving the IEM would revert us back to less efficient interconnector trading. Uneconomic trades (buying dear, selling cheap) could occur up to 20% of the time2
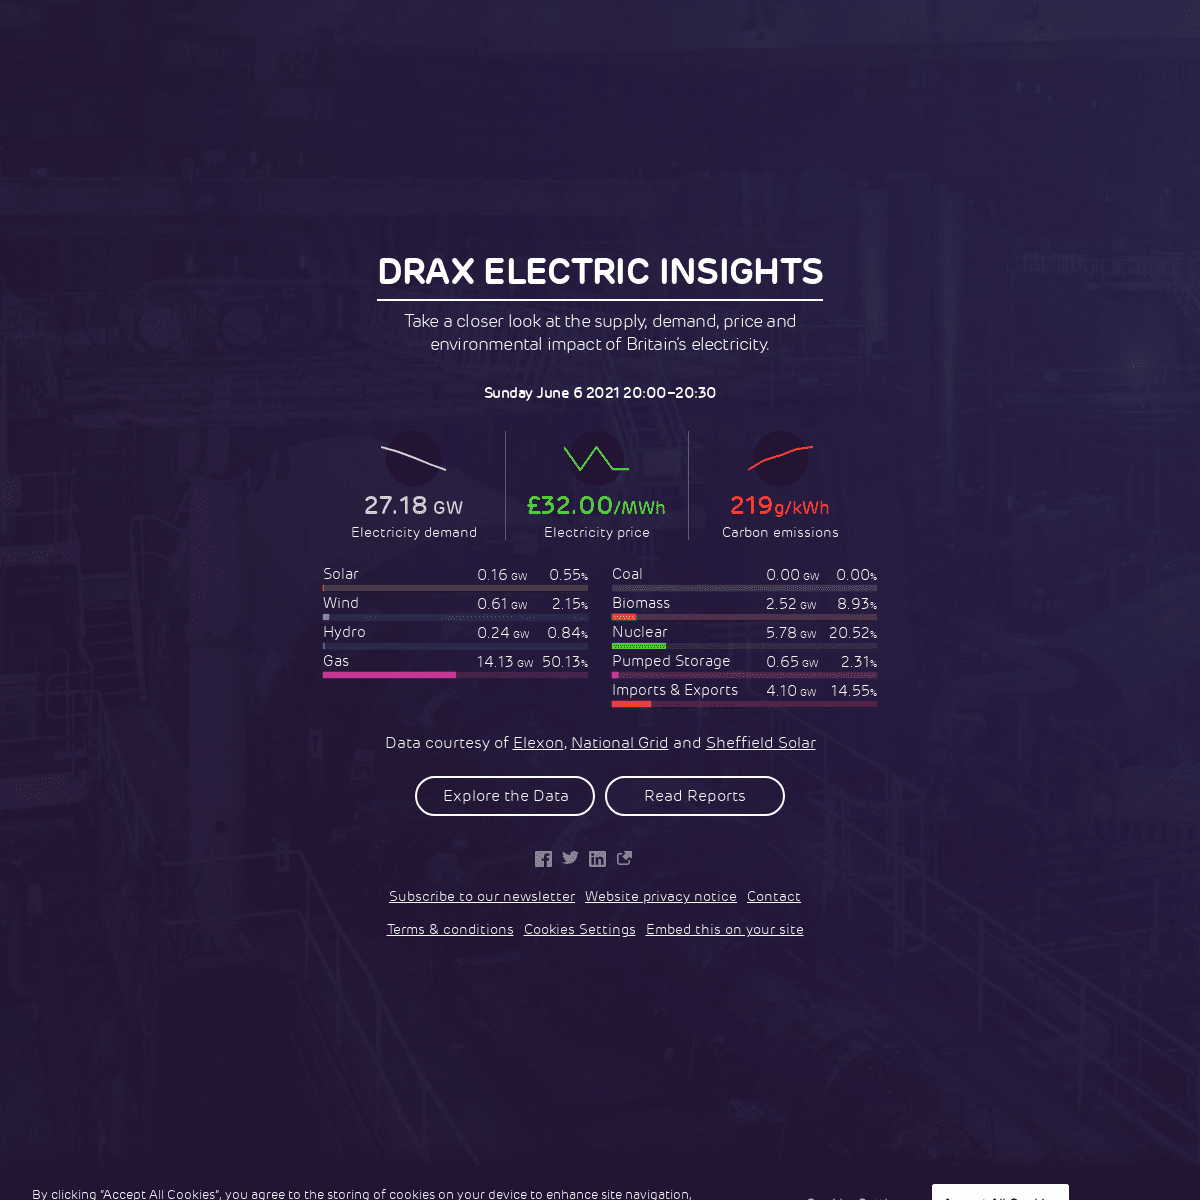
DRAX ELECTRIC INSIGHTS Take a closer look at the supply, demand, price and environmental impact of Britain’s electricity. Sunday June 6 2021 20:00–20:3027.18 GW
Electricity demand
�32.00/MWh
Electricity price
219g/kWh
Carbon emissions
*
0.16 GW
0.55%
SOLAR
*
0.61 GW
2.15%
WIND
*
0.24 GW
0.84%
HYDRO
*
14.13 GW
50.13%
GAS
*
0.00 GW
0.00%
COAL
*
2.52 GW
8.93%
BIOMASS
*
5.78 GW
20.52%
NUCLEAR
*
0.65 GW
2.31%
PUMPED STORAGE
*
4.10 GW
14.55%
IMPORTS & EXPORTS
Data courtesy of Elexon ,National Grid
and Sheffield Solar Explore the DataRead Reports Subscribe to our newsletter Website privacy noticeContact
Terms & conditions Cookies SettingsEmbedthis on your site
Loading
ELECTRIC INSIGHTS
PRIVACY PREFERENCE CENTER When you visit any website, it may store or retrieve information on your browser, mostly in the form of cookies. This information might be about you, your preferences or your device and is mostly used to make the site work as you expect it to. The information does not usually directly identify you, but it can give you a more personalised web experience. Because we respect your right to privacy, you can choose not to allow some types of cookies. Click on the different category headings to find out more and change our default settings. However, blocking some types of cookies may impact your experience of the site and the services we are able to offer. More informationAllow All
MANAGE CONSENT PREFERENCES STRICTLY NECESSARY COOKIESAlways Active
These cookies are necessary for the website to function and cannot be switched off in our systems. They are usually only set in response to actions made by you which amount to a request for services, such as setting your privacy preferences, logging in or filling in forms. You can set your browser to block or alert you about these cookies, but some parts of the site will not then work. These cookies do not store any personally identifiable information.ANALYTICS COOKIES
Analytics Cookies
These cookies allow us to count visits and traffic sources so we can measure and improve the performance of our site. They help us to know which pages are the most and least popular and see how visitors move around the site. All information these cookies collect is aggregated and therefore anonymous. If you do not allow these cookies we will not know when you have visited our site, and will not be able to monitorits performance.
TARGETING COOKIES
Targeting Cookies
These cookies may be set through our site by our advertising partners. They may be used by those companies to build a profile of your interests and show you relevant adverts on other sites. They do not store directly personal information, but are based on uniquely identifying your browser and internet device. If you do not allow these cookies, you will experience less targeted advertising. BACK BUTTON PERFORMANCE COOKIES Vendor Search Search IconFilter Icon
Clear
checkbox label labelApply Cancel
Consent Leg.Interest checkbox label label checkbox label label checkbox label label*
33ACROSS
HOST DESCRIPTION
VIEW COOKIES
*
Name
cookie name
*
33ACROSS
View Privacy Notice
Confirm My Choices
By clicking “Accept All Cookies”, you agree to the storing of cookies on your device to enhance site navigation, analyse site usage, and assist in our marketing efforts. Cookies Settings Accept All CookiesDetails
3