5
More Annotations


6


1
Favourite Annotations


3


1
Text
BLOCKCHAINCENTER
Krypto Kurse & Vergleich. Market Cap Price 1 h 1 day 7 days 30 days 90 days 1 year 2 years ATH Market Cap; 1 BITCOIN RAINBOW CHART (LIVE) The Rainbow Chart is not investment advice! Past performance is not an indication of future results. The Rainbow Chart is meant to be be a fun way of looking at long term price movements, disregarding the daily volatility "noise". The color bands follow a logarithmic regression (introduced by Bitcoi ALTCOIN SEASON INDEX: IS IT ALTSEASON RIGHT NOW? What is an Altcoin Season? If 75% of the Top 50 coins performed better than Bitcoin over the last season (90 days) it is Altcoin Season.BITCOIN SUPPLY
Bitcoin Supply Visualized= 1000 BTC. Bitcoin Supply Visualized. 2 386 000 BTC on exchanges. Coins in Cold Storage of Huobi, Binance, BitMex, Bitfinex Coinbase & Co. Source. 1 700 000 BTC are Zombie Coins. Zombie Coins that haven't moved since 2010. Includes Satoshis Coins. CRYPTOCURRENCY WORLD MAP The map visualizes search interest for different coins by country, with the data sourced from Google Trends. Google Trends normalizes search data to facilitate comparisons between terms. Consequently, a percentage of 90% for Bitcoin and 10% for Ethereum means that the search volume for “Bitcoin” is nine times higher than that of“Ethereum”.
CRYPTOCURRENCY CORRELATION TOOL & STUDY We investigated the correlation between the returns of some Cryptocurrencies, gold and big stock indices (S&P 500 and Dow Jones). The Pearson correlation coefficient shows the extend to which two data sets (in this case: daily returns) are related. It takes values between -1 and 1: 1. ETHEREUM RAINBOW CHART Look: Rainbow Charts can’t predict the price of cryptocurrencies. Unlike the Bitcoin Rainbow Chart which at least goes back to 2014, I literally just tweaked the formula for the chart until it fits reasonable well to the price development. This is not investment advice! I am just responding to popular requests to make an “Ethereum Rainbow Chart”, because people (and the Ethereum THE FLIPPENING INDEX The term "Flippening" refers to the hypothetical moment of Ethereum (ETH) overtaking Bitcoin (BTC) as the biggest cryptocurrency. At 100% they both have the same market capitalization. Even though market cap is the main metric to determine "The Flippening" (above), there are a number of other metrics that can be observed (below).ETHEREUM 2.0
Ethereum 2.0 ist das Projekt zum Übergang von Ethereum zu einem Proof-of-Stake Konsens Verfahren.. Der komplette Prozess wird mehrere Jahre in Anspruch nehmen. Der Start (Phase 0) ist am 1.Dezember 2020 mit dem Start der “Beacon Chain” gestartet. In späteren Phasen werden weitere Funktionen hinzugefügt, bis Ethereum 2.0 fertig ist. BNB (BINANCE) RECHNER 1 EUR: sind in BNB : 0,00349822 BNB: 10 EUR: sind in BNB : 0,03498216 BNB: 100 EUR: sind in BNB : 0,34982159 BNB: 1000 EUR: sind in BNB : 3,49821591 BNB: 10000 EURBLOCKCHAINCENTER
Krypto Kurse & Vergleich. Market Cap Price 1 h 1 day 7 days 30 days 90 days 1 year 2 years ATH Market Cap; 1 ETHEREUM CLASSIC KURS Disclaimer: Der Handel mit Kryptowährungen birgt ein hohes Risiko und kann bis zum Totalverlust des eingesetzten Kapitals führen. Keine der hier aufgeführten Informationen sind als Anlageberatatung zuverstehen.
CRYPTOCURRENCY BEST PRACTICES "Be your own bank" is the inofficial motto of the cryptocurrency community. But as Spiderman's uncle Ben so perfectly put: "With great power comes great responsibility" The money in the "Swiss bank account in your pocket" can only be as safe as the with real banks if you consider a couple of tCRYPTO COCKPIT
Google trends Miner Revenue (USD) Trade Volume Monthly Active Users Locked ETH Locked USD Tx Count Monthly Transactions Locked BTC Active addresses Dapp Count Rank Tx per address Contracts Market Cap Volume in USD Transactions User Trade Volumne (Nomics) Active on Reddit Tx Volume (USD, adjusted) Average Fees Trading pairs Trade Count Volume/Trade Average Fees (USD) Median XRP KURS - BLOCKCHAINCENTERTRANSLATE THIS PAGE Disclaimer: Der Handel mit Kryptowährungen birgt ein hohes Risiko und kann bis zum Totalverlust des eingesetzten Kapitals führen. Keine der hier aufgeführten Informationen sind als Anlageberatatung zuverstehen.
CRYPTO COCKPIT
While it is possible to use more than 2 metrics in one chart, you really shouldn't Table is fine though. The Crypto Cockpit is being rebuilt. This version is now deprecated. Please use theblockcrypto.com instead. Weekly active addresses. 3,87 Mio. -14,5 %. Weeklytransactions.
DOGECOIN KURS (DOGE) Disclaimer: Der Handel mit Kryptowährungen birgt ein hohes Risiko und kann bis zum Totalverlust des eingesetzten Kapitals führen. Keine der hier aufgeführten Informationen sind als Anlageberatatung zuverstehen.
VECHAIN (VET) KURS
Disclaimer: Der Handel mit Kryptowährungen birgt ein hohes Risiko und kann bis zum Totalverlust des eingesetzten Kapitals führen. Keine der hier aufgeführten Informationen sind als Anlageberatatung zuverstehen.
FOMO3D PYRAMID / PONZI SCHEME Warning!!! 'Fomo3D' is an insidious mixture of a ponzi scheme and a game with an apparent chance of winning. A lot of people will lose a big part of their stakes. There's no doubt about that. This experiment is intended to educate and warn potential victims. All profits fromthe self-experiment
AMAZON.COM NOW SELLS CRYPTOCURRENCIES! If you think about it, it totally makes sense: You can buy almost anything on Amazon.com so why not cryptocurrencies? That’s what probably went through Jeff Bezos’ head as well, because as of today you can buy cryptocurrency directly from Amazon.com! After the announcement of Facebooks own coin and Apples rumored cryptocurrency support in their new credit card it was only a matter of timeBLOCKCHAINCENTER
Krypto Kurse & Vergleich. Market Cap Price 1 h 1 day 7 days 30 days 90 days 1 year 2 years ATH Market Cap; 1 BITCOIN RAINBOW CHART (LIVE) The Rainbow Chart is not investment advice! Past performance is not an indication of future results. The Rainbow Chart is meant to be be a fun way of looking at long term price movements, disregarding the daily volatility "noise". The color bands follow a logarithmic regression (introduced by BitcoiBITCOIN SUPPLY
Bitcoin Supply Visualized= 1000 BTC. Bitcoin Supply Visualized. 2 386 000 BTC on exchanges. Coins in Cold Storage of Huobi, Binance, BitMex, Bitfinex Coinbase & Co. Source. 1 700 000 BTC are Zombie Coins. Zombie Coins that haven't moved since 2010. Includes Satoshis Coins. ALTCOIN SEASON INDEX: IS IT ALTSEASON RIGHT NOW? What is an Altcoin Season? If 75% of the Top 50 coins performed better than Bitcoin over the last season (90 days) it is Altcoin Season. CRYPTOCURRENCY WORLD MAP The map visualizes search interest for different coins by country, with the data sourced from Google Trends. Google Trends normalizes search data to facilitate comparisons between terms. Consequently, a percentage of 90% for Bitcoin and 10% for Ethereum means that the search volume for “Bitcoin” is nine times higher than that of“Ethereum”.
ETHEREUM RAINBOW CHART Look: Rainbow Charts can’t predict the price of cryptocurrencies. Unlike the Bitcoin Rainbow Chart which at least goes back to 2014, I literally just tweaked the formula for the chart until it fits reasonable well to the price development. This is not investment advice! I am just responding to popular requests to make an “Ethereum Rainbow Chart”, because people (and the EthereumETHEREUM 2.0
Ethereum 2.0 ist das Projekt zum Übergang von Ethereum zu einem Proof-of-Stake Konsens Verfahren.. Der komplette Prozess wird mehrere Jahre in Anspruch nehmen. Der Start (Phase 0) ist am 1.Dezember 2020 mit dem Start der “Beacon Chain” gestartet. In späteren Phasen werden weitere Funktionen hinzugefügt, bis Ethereum 2.0 fertig ist. THE FLIPPENING INDEX The term "Flippening" refers to the hypothetical moment of Ethereum (ETH) overtaking Bitcoin (BTC) as the biggest cryptocurrency. At 100% they both have the same market capitalization. Even though market cap is the main metric to determine "The Flippening" (above), there are a number of other metrics that can be observed (below).BINANCE KREDITKARTE
Die wichtigsten Infos zur Binance Kreditkarte Seit September 2020 bietet Binance in Europa die Binance VISA Karte an.Ein Vorteil ist die hohe Cashback-Rate von bis zu 8 %, die von der Anzahl der gehaltenen BNB Token abhängt.Außerdem werden erst beim Kauf mit der Kreditkarte Kryptowährungen in Eur DIE BESTEN KRYPTO-FONDS FÜR PRIVATANLEGER (CRYPTO …TRANSLATE THISPAGE
Der Bitpanda Krypto-Index ist ein echter Index der mit tatsächlichen Kryptowerten gesichert ist. Es gibt drei verschiedene Indizes bestehend aus 5, 10, oder 25 Kryptowährungen. Der Bitpanda Crypto Index kann auch im Rahmen eines Sparplans gekauft werden. regulierter Krypto-Index mit 5, 10 oder 25 Kryptowährungen. monatlichesRebalancing.
BLOCKCHAINCENTER
Krypto Kurse & Vergleich. Market Cap Price 1 h 1 day 7 days 30 days 90 days 1 year 2 years ATH Market Cap; 1 BITCOIN RAINBOW CHART (LIVE) The Rainbow Chart is not investment advice! Past performance is not an indication of future results. The Rainbow Chart is meant to be be a fun way of looking at long term price movements, disregarding the daily volatility "noise". The color bands follow a logarithmic regression (introduced by BitcoiBITCOIN SUPPLY
Bitcoin Supply Visualized= 1000 BTC. Bitcoin Supply Visualized. 2 386 000 BTC on exchanges. Coins in Cold Storage of Huobi, Binance, BitMex, Bitfinex Coinbase & Co. Source. 1 700 000 BTC are Zombie Coins. Zombie Coins that haven't moved since 2010. Includes Satoshis Coins. ALTCOIN SEASON INDEX: IS IT ALTSEASON RIGHT NOW? What is an Altcoin Season? If 75% of the Top 50 coins performed better than Bitcoin over the last season (90 days) it is Altcoin Season. CRYPTOCURRENCY WORLD MAP The map visualizes search interest for different coins by country, with the data sourced from Google Trends. Google Trends normalizes search data to facilitate comparisons between terms. Consequently, a percentage of 90% for Bitcoin and 10% for Ethereum means that the search volume for “Bitcoin” is nine times higher than that of“Ethereum”.
ETHEREUM RAINBOW CHART Look: Rainbow Charts can’t predict the price of cryptocurrencies. Unlike the Bitcoin Rainbow Chart which at least goes back to 2014, I literally just tweaked the formula for the chart until it fits reasonable well to the price development. This is not investment advice! I am just responding to popular requests to make an “Ethereum Rainbow Chart”, because people (and the EthereumETHEREUM 2.0
Ethereum 2.0 ist das Projekt zum Übergang von Ethereum zu einem Proof-of-Stake Konsens Verfahren.. Der komplette Prozess wird mehrere Jahre in Anspruch nehmen. Der Start (Phase 0) ist am 1.Dezember 2020 mit dem Start der “Beacon Chain” gestartet. In späteren Phasen werden weitere Funktionen hinzugefügt, bis Ethereum 2.0 fertig ist. MARKET CAP & DOMINANCE BY CATEGORY Overall Market Cap & Dominance This is just the old overall market cap & dominance chart. It is bad since it doesn't make sense to compare Bitcoin to for example Tether or even Ethereum. That is why the below charts break the coins down by category. Please note that thedistinction be
CRYPTOCURRENCY CORRELATION TOOL & STUDY We investigated the correlation between the returns of some Cryptocurrencies, gold and big stock indices (S&P 500 and Dow Jones). The Pearson correlation coefficient shows the extend to which two data sets (in this case: daily returns) are related. It takes values between -1 and 1: 1. BTT COIN (BITTORRENT) KAUFEN, ALLE INFOS BTT Coin (BitTorrent) kaufen, alle Infos - BlockchaincenterSAFEMOON (SAFE)
Historie, Entwicklung und aktueller Stand Safemoon ist ein Meme-Token aus 2021. Die Zahl der Holder wuchs in im Frühjahr 2021 täglich undist seit Beginn des
SUSHISWAP - BLOCKCHAINCENTERTRANSLATE THIS PAGE Sushiswap in aller Kürze Sushiswap ist ein experimenteller Uniswap Klon (dezentrale Exchange), die per Liquidity Mining einen Token (SUSHI) eingeführt hat.Der Token berechtigt zu einem Anteil der 0,05% Handelsgebühren die an SUSHI Halter ausgeschüttet werden.Inzwischen ist Sushiswap zu einer echt DIEM COIN - (EHEMALS FACEBOOK LIBRA)TRANSLATE THIS PAGE Das Wichtigste zu Facebooks "Diem" Diem ist eine Blockchain-basierte Kryptowährung, die aus der Initiative von Facebook entstanden ist. Sie war anfangs als Libra bekannt.Aktuell plant die Diem Association, Diem 2021 an den Start zu bringen. Diem lassen sich noch nicht kaufen.Mitte 2020 änderte siBINANCE KREDITKARTE
Die wichtigsten Infos zur Binance Kreditkarte Seit September 2020 bietet Binance in Europa die Binance VISA Karte an.Ein Vorteil ist die hohe Cashback-Rate von bis zu 8 %, die von der Anzahl der gehaltenen BNB Token abhängt.Außerdem werden erst beim Kauf mit der Kreditkarte Kryptowährungen in Eur UNI TOKEN DER UNISWAP EXCHANGE Alle Infos zum UNI Token von Uniswap UNI ist der Coin der Uniswap Exchange der am 17.09.2020 gestartet wurdeJeder der vor dem 01.09.2020 auf Uniswap gehandelt hat, hat einen Anspruch auf 400 UNI TokenBis in 4 Jahren es 1.000.000.000 UNI Token NURI (EHEMALS BITWALA) Erfahrungsberichte zu Nuri (ehemals Bitwala) Michael am 06.05.2021. Eine Sache, die nirgendwo erwähnt wird ist daß man mit der Bitwala VISA Karte nur bezahlen kann, wenn ein EUR Guthaben auf dem Konto ist. D.h. wenn man das gesamte Guthaben als Krypto auf dem Wallet hat (BTC oder ETH), kann man nicht automatisch in Euro bezahlen. DIE BESTEN KRYPTO-FONDS FÜR PRIVATANLEGER (CRYPTO …TRANSLATE THISPAGE
Der Bitpanda Krypto-Index ist ein echter Index der mit tatsächlichen Kryptowerten gesichert ist. Es gibt drei verschiedene Indizes bestehend aus 5, 10, oder 25 Kryptowährungen. Der Bitpanda Crypto Index kann auch im Rahmen eines Sparplans gekauft werden. regulierter Krypto-Index mit 5, 10 oder 25 Kryptowährungen. monatlichesRebalancing.
BLOCKCHAINCENTER
Krypto Kurse & Vergleich. Market Cap Price 1 h 1 day 7 days 30 days 90 days 1 year 2 years ATH Market Cap; 1 BITCOIN RAINBOW CHART (LIVE) The Rainbow Chart is not investment advice! Past performance is not an indication of future results. The Rainbow Chart is meant to be be a fun way of looking at long term price movements, disregarding the daily volatility "noise". The color bands follow a logarithmic regression (introduced by Bitcoi ALTCOIN SEASON INDEX: IS IT ALTSEASON RIGHT NOW? What is an Altcoin Season? If 75% of the Top 50 coins performed better than Bitcoin over the last season (90 days) it is Altcoin Season.BITCOIN SUPPLY
Bitcoin Supply Visualized= 1000 BTC. Bitcoin Supply Visualized. 2 386 000 BTC on exchanges. Coins in Cold Storage of Huobi, Binance, BitMex, Bitfinex Coinbase & Co. Source. 1 700 000 BTC are Zombie Coins. Zombie Coins that haven't moved since 2010. Includes Satoshis Coins. CRYPTOCURRENCY WORLD MAP The map visualizes search interest for different coins by country, with the data sourced from Google Trends. Google Trends normalizes search data to facilitate comparisons between terms. Consequently, a percentage of 90% for Bitcoin and 10% for Ethereum means that the search volume for “Bitcoin” is nine times higher than that of“Ethereum”.
ETHEREUM RAINBOW CHART Look: Rainbow Charts can’t predict the price of cryptocurrencies. Unlike the Bitcoin Rainbow Chart which at least goes back to 2014, I literally just tweaked the formula for the chart until it fits reasonable well to the price development. This is not investment advice! I am just responding to popular requests to make an “Ethereum Rainbow Chart”, because people (and the Ethereum CRYPTOCURRENCY CORRELATION TOOL & STUDY We investigated the correlation between the returns of some Cryptocurrencies, gold and big stock indices (S&P 500 and Dow Jones). The Pearson correlation coefficient shows the extend to which two data sets (in this case: daily returns) are related. It takes values between -1 and 1: 1. THE FLIPPENING INDEX The term "Flippening" refers to the hypothetical moment of Ethereum (ETH) overtaking Bitcoin (BTC) as the biggest cryptocurrency. At 100% they both have the same market capitalization. Even though market cap is the main metric to determine "The Flippening" (above), there are a number of other metrics that can be observed (below). BNB (BINANCE) RECHNER 1 EUR: sind in BNB : 0,00313352 BNB: 10 EUR: sind in BNB : 0,03133519 BNB: 100 EUR: sind in BNB : 0,31335193 BNB: 1000 EUR: sind in BNB : 3,13351926 BNB: 10000 EUR DIE BESTEN KRYPTO-FONDS FÜR PRIVATANLEGER (CRYPTO …TRANSLATE THISPAGE
Der Bitpanda Krypto-Index ist ein echter Index der mit tatsächlichen Kryptowerten gesichert ist. Es gibt drei verschiedene Indizes bestehend aus 5, 10, oder 25 Kryptowährungen. Der Bitpanda Crypto Index kann auch im Rahmen eines Sparplans gekauft werden. regulierter Krypto-Index mit 5, 10 oder 25 Kryptowährungen. monatlichesRebalancing.
MARKET CAP & DOMINANCE BY CATEGORY Overall Market Cap & Dominance This is just the old overall market cap & dominance chart. It is bad since it doesn't make sense to compare Bitcoin to for example Tether or even Ethereum. That is why the below charts break the coins down by category. Please note that thedistinction be
ETHEREUM 2.0
Das Wichtigste zu Ethereum 2.0 Ethereum 2.0 ist das Projekt zum Übergang von Ethereum zu einem Proof-of-Stake Konsens Verfahren..Der komplette Prozess wird mehrere Jahre in Anspruch nehmen.Der Start (Phase 0) ist am 1.Dezember 2020 mit dem Start der BTT COIN (BITTORRENT) KAUFEN, ALLE INFOS BTT Coin (BitTorrent) kaufen, alle Infos - BlockchaincenterSAFEMOON (SAFE)
Historie, Entwicklung und aktueller Stand Safemoon ist ein Meme-Token aus 2021. Die Zahl der Holder wuchs in im Frühjahr 2021 täglich undist seit Beginn des
DIEM COIN - (EHEMALS FACEBOOK LIBRA)TRANSLATE THIS PAGE Das Wichtigste zu Facebooks "Diem" Diem ist eine Blockchain-basierte Kryptowährung, die aus der Initiative von Facebook entstanden ist. Sie war anfangs als Libra bekannt.Aktuell plant die Diem Association, Diem 2021 an den Start zu bringen. Diem lassen sich noch nicht kaufen.Mitte 2020 änderte si BITCOIN CASH RECHNER 1 EUR: sind in BCH : 0,00184846 BCH: 10 EUR: sind in BCH : 0,01848463 BCH: 100 EUR: sind in BCH : 0,18484630 BCH: 1000 EUR: sind in BCH : 1,84846300 BCH: 10000 EUR ANIMATION: CRYPTOCURRENCY MARKET CAP OVER TIMETRANSLATE THIS PAGE Cryptocurrency Market Cap over time (in Mio) 01.01.2017. Über Holger. Follow me on Twitter: @rohmeo_de Permabull - Tweets mostly crypto charts & data porn (aka. Bitcoin Rainbow Rainbow Chart guy) - Sockpuppet for @blockchaincent - Co-Host KONSENS & NONSENS Podcast.BITCOIN RECHNER
Die Bitcoin-Einheiten. 1 Bitcoin hat acht Nachkommastellen. Das allein macht die Umrechnung von BTC-Beträgen in Euro nicht besonders leicht. Hinzu kommt, dass Bitcoin bei einem aktuellen Preis von rund Array Euro so hoch ist, dass kleinere Beträge wie zum Beispiel 20MONERO RECHNER
1 EUR: sind in XMR : 0,004184 XMR: 10 EUR: sind in XMR : 0,041845 XMR: 100 EUR: sind in XMR : 0,418445 XMR: 1000 EUR: sind in XMR : 4,184451 XMR: 10000 EUR: sind in XMR BITCOIN MIT GIROPAY KAUFEN (BTC) Disclaimer: Der Handel mit Kryptowährungen birgt ein hohes Risiko und kann bis zum Totalverlust des eingesetzten Kapitals führen. Keine der hier aufgeführten Informationen sindMENUMENU
*
* Tools & Charts
*
*
* Bitcoin Rechner
* Market Cap & Dominanz* Ethereum Rechner
* Broker Gebührencheck*
* Bitcoin Rainbow Chart * Altcoin Season Index * Bitcoin Supply – Visualized * Dollar Cost Averaging Tool*
* The Flippening Index* ROI Vergleich
* Correlation Tool
*
* Crypto Heatmap
* Crypto World Map
* Tweets in Charts
* Vergleiche
*
*
* Krypto Börsen Vergleich* BISON App
* Nuri (ehemals Bitwala)* Binance
* Bitpanda
* Coinmerce
* eToro
* Relai
* Broker Gebührencheck * Vier Coinbase-Alternativen*
* Bitcoin-Kreditkarten Vergleich * Bitpanda Kreditkarte * Binance Kreditkarte* Swipe Kreditkarte
*
* Hardware Wallets
* Ledger Nano X
* Bitbox02
* Kryptowährungen
*
*
* Bitcoin
* Bitcoin Wallet
* Bitcoin-Kreditkarten* Bitcoin Kurs
* Bitcoin Exchange
* Bitcoin-Sparplan
* Bitcoin als Investition * Bitcoin Alternative* Bitcoin-Aktien
* Bitcoin mit Sofortüberweisung*
* Ethereum
* Ethereum 2.0
* Ethereum Staking
* Ethereum Wallet
* Ethereum Kurs
* IOTA
* IOTA Wallets
* IOTA Hardware Wallet*
* Weitere Top Coins
* XRP / Ripple
* Bitcoin Cash
* Binance Coin
* Cardano
* DASH
* Tron
* EOS
*
* Aktuelle Themen
* CBDC
* DeFi Coins
* Diem (ehemals Libra)* Ratgeber
*
*
* Einsteiger Serie
* 1. Warum Kryptowährungen * 2. In Kryptowährungen investieren? * 3. Welche Kryptowährungen? * 4. Kryptowährungen kaufen * 5. Kryptowährungen verwenden * 6. Kryptowährungen verwalten * 7. Kryptowährungen sicher aufbewahren * 8. Ausblick in die Zukunft*
* Krypto
* Kryptowährungen versteuern* Krypto Kredite
* Krypto Zinsen
* Krypto Fonds
*
* DEFI
* Yield Farming
* NFTs kaufen
* DeFi Coins
* 1inch Exchange
* Uniswap
* Sushiswap
*
* Wissen
* dApps
* DEX
* FUD
* HODL
* Security Token
* Smart Contracts
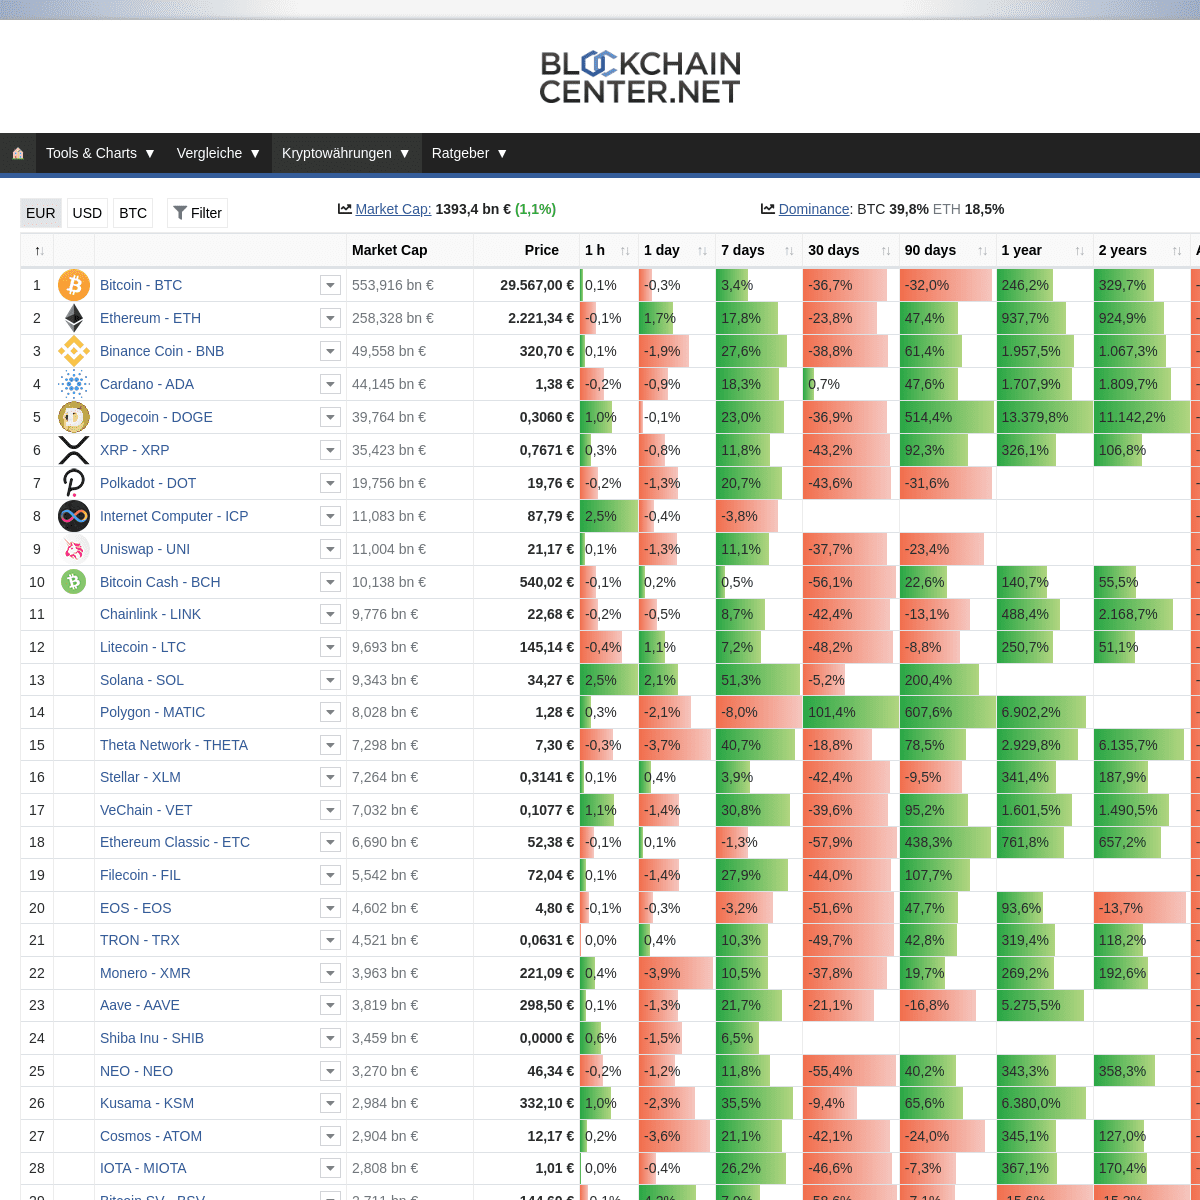
* Non-fungible Token (NFTs) EURUSDBTC __ Filter__ Market Cap:
1393,4 BN €
(1,1%)
__ Dominance
: BTC 39,8%
ETH 18,5%
Coins nach Typ filtern Ethereum TokenPrivacy CoinsDeFi CoinsStable CoinsExchange TokenCryptocurrencySmart ContractsAsset-backed Token (WBTC...)Non-fungible Token<2017201520162017201820192020 Coins ausschließen Ethereum TokenPrivacy CoinsDeFi CoinsStable CoinsExchange TokenCryptocurrencySmart ContractsAsset-backed Token (WBTC...)Non-fungible TokenMARKET CAP
PRICE
1 H
1 DAY
7 DAYS
30 DAYS
90 DAYS
1 YEAR
2 YEARS
ATH
MARKET CAP
1
Bitcoin - BTC __
553,916 bn €
29.567,00 €
0,1%
-0,3%
3,4%
-36,7%
-32,0%
246,2%
329,7%
-44,4%
553,916 bn €
2
Ethereum - ETH __
258,328 bn €
2.221,34 €
-0,1%
1,7%
17,8%
-23,8%
47,4%
937,7%
924,9%
-34,9%
258,328 bn €
3
Binance Coin - BNB __49,558 bn €
320,70 €
0,1%
-1,9%
27,6%
-38,8%
61,4%
1.957,5%
1.067,3%
-42,1%
49,558 bn €
4
Cardano - ADA __
44,145 bn €
1,38 €
-0,2%
-0,9%
18,3%
0,7%
47,6%
1.707,9%
1.809,7%
-26,6%
44,145 bn €
5
Dogecoin - DOGE __
39,764 bn €
0,3060 €
1,0%
-0,1%
23,0%
-36,9%
514,4%
13.379,8%
11.142,2%
-44,8%
39,764 bn €
6
XRP - XRP __
35,423 bn €
0,7671 €
0,3%
-0,8%
11,8%
-43,2%
92,3%
326,1%
106,8%
-72,6%
35,423 bn €
7
Polkadot - DOT __
19,756 bn €
19,76 €
-0,2%
-1,3%
20,7%
-43,6%
-31,6%
-47,8%
19,756 bn €
8
Internet Computer - ICP __11,083 bn €
87,79 €
2,5%
-0,4%
-3,8%
-74,2%
11,083 bn €
9
Uniswap - UNI __
11,004 bn €
21,17 €
0,1%
-1,3%
11,1%
-37,7%
-23,4%
-41,4%
11,004 bn €
10
Bitcoin Cash - BCH __10,138 bn €
540,02 €
-0,1%
0,2%
0,5%
-56,1%
22,6%
140,7%
55,5%
-83,7%
10,138 bn €
11
Chainlink - LINK __
9,776 bn €
22,68 €
-0,2%
-0,5%
8,7%
-42,4%
-13,1%
488,4%
2.168,7%
-45,2%
9,776 bn €
12
Litecoin - LTC __
9,693 bn €
145,14 €
-0,4%
1,1%
7,2%
-48,2%
-8,8%
250,7%
51,1%
-52,3%
9,693 bn €
13
Solana - SOL __
9,343 bn €
34,27 €
2,5%
2,1%
51,3%
-5,2%
200,4%
-23,0%
9,343 bn €
14
Polygon - MATIC __
8,028 bn €
1,28 €
0,3%
-2,1%
-8,0%
101,4%
607,6%
6.902,2%
-35,7%
8,028 bn €
15
Theta Network - THETA __7,298 bn €
7,30 €
-0,3%
-3,7%
40,7%
-18,8%
78,5%
2.929,8%
6.135,7%
-37,6%
7,298 bn €
16
Stellar - XLM __
7,264 bn €
0,3141 €
0,1%
0,4%
3,9%
-42,4%
-9,5%
341,4%
187,9%
-55,7%
7,264 bn €
17
VeChain - VET __
7,032 bn €
0,1077 €
1,1%
-1,4%
30,8%
-39,6%
95,2%
1.601,5%
1.490,5%
-51,7%
7,032 bn €
18
Ethereum Classic - ETC __6,690 bn €
52,38 €
-0,1%
0,1%
-1,3%
-57,9%
438,3%
761,8%
657,2%
-57,9%
6,690 bn €
19
Filecoin - FIL __
5,542 bn €
72,04 €
0,1%
-1,4%
27,9%
-44,0%
107,7%
-57,2%
5,542 bn €
20
EOS - EOS __
4,602 bn €
4,80 €
-0,1%
-0,3%
-3,2%
-51,6%
47,7%
93,6%
-13,7%
-71,5%
4,602 bn €
21
TRON - TRX __
4,521 bn €
0,0631 €
0,0%
0,4%
10,3%
-49,7%
42,8%
319,4%
118,2%
-63,7%
4,521 bn €
22
Monero - XMR __
3,963 bn €
221,09 €
0,4%
-3,9%
10,5%
-37,8%
19,7%
269,2%
192,6%
-43,5%
3,963 bn €
23
Aave - AAVE __
3,819 bn €
298,50 €
0,1%
-1,3%
21,7%
-21,1%
-16,8%
5.275,5%
-43,1%
3,819 bn €
24
Shiba Inu - SHIB __
3,459 bn €
0,0000 €
0,6%
-1,5%
6,5%
-48,3%
3,459 bn €
25
NEO - NEO __
3,270 bn €
46,34 €
-0,2%
-1,2%
11,8%
-55,4%
40,2%
343,3%
358,3%
-69,6%
3,270 bn €
26
Kusama - KSM __
2,984 bn €
332,10 €
1,0%
-2,3%
35,5%
-9,4%
65,6%
6.380,0%
-31,8%
2,984 bn €
27
Cosmos - ATOM __
2,904 bn €
12,17 €
0,2%
-3,6%
21,1%
-42,1%
-24,0%
345,1%
127,0%
-48,9%
2,904 bn €
28
IOTA - MIOTA __
2,808 bn €
1,01 €
0,0%
-0,4%
26,2%
-46,6%
-7,3%
367,1%
170,4%
-76,9%
2,808 bn €
29
Bitcoin SV - BSV __
2,711 bn €
144,60 €
-0,1%
4,2%
7,0%
-58,6%
-7,1%
-15,6%
-15,3%
-60,1%
2,711 bn €
30
Celsius Network - CEL __2,696 bn €
6,37 €
0,0%
1,1%
11,3%
20,0%
37,9%
2.735,0%
-3,0%
2,696 bn €
31
PancakeSwap - CAKE __2,694 bn €
15,07 €
-0,3%
-4,1%
24,7%
-50,5%
54,2%
-56,3%
2,694 bn €
32
Maker - MKR __
2,665 bn €
2.958,83 €
0,2%
-1,6%
17,2%
-30,6%
62,8%
579,3%
366,1%
-43,2%
2,665 bn €
33
Klaytn - KLAY __
2,582 bn €
1,04 €
-0,6%
-1,9%
-6,1%
-47,7%
-58,6%
2,582 bn €
34
Crypto.com Coin - CRO __2,535 bn €
0,1004 €
0,8%
-0,6%
7,5%
-36,4%
-24,8%
8,8%
75,5%
-53,5%
2,535 bn €
35
Algorand - ALGO __
2,514 bn €
0,8199 €
-0,2%
-2,0%
18,8%
-35,4%
-14,3%
290,8%
-43,1%
2,514 bn €
36
FTX Token - FTT __
2,441 bn €
27,96 €
-0,4%
-1,4%
12,0%
-41,9%
5,2%
960,1%
-44,5%
2,441 bn €
37
Tezos - XTZ __
2,403 bn €
2,88 €
0,4%
0,8%
9,0%
-55,5%
-20,9%
11,4%
144,5%
-55,5%
2,403 bn €
38
Huobi Token - HT __
2,246 bn €
12,83 €
0,2%
-1,8%
4,6%
-34,7%
-1,2%
230,6%
370,4%
-60,5%
2,246 bn €
39
THORChain - RUNE __
2,241 bn €
8,91 €
-0,6%
-3,2%
7,5%
-38,0%
86,0%
6.862,0%
-46,6%
2,241 bn €
40
BitTorrent - BTT __
2,188 bn €
0,0033 €
0,1%
-1,1%
11,7%
-49,0%
210,7%
1.045,0%
196,6%
-67,4%
2,188 bn €
41
Terra - LUNA __
2,116 bn €
5,11 €
1,0%
-1,8%
13,2%
-63,2%
-37,2%
2.630,0%
-72,6%
2,116 bn €
42
LEO Token - LEO __
1,996 bn €
2,10 €
-0,3%
-3,0%
22,8%
-14,3%
29,6%
90,5%
-35,0%
1,996 bn €
43
Theta Fuel - TFUEL __1,950 bn €
0,3680 €
1,7%
-3,2%
55,6%
2.810,4%
1,950 bn €
44
Avalanche - AVAX __
1,915 bn €
14,66 €
0,8%
-0,6%
10,2%
-53,0%
-31,5%
-69,2%
1,915 bn €
45
SafeMoon - SAFEMOON __1,893 bn €
0,0000 €
0,3%
2,4%
-0,7%
-63,3%
1,893 bn €
46
Amp - AMP __
1,781 bn €
0,0387 €
0,3%
7,9%
41,2%
-34,4%
121,4%
-95,1%
1,781 bn €
47
Compound - COMP __
1,653 bn €
316,84 €
0,0%
-1,7%
8,6%
-48,7%
-20,0%
-55,3%
1,653 bn €
48
Sushi - SUSHI __
1,640 bn €
9,54 €
0,1%
1,3%
15,0%
-30,4%
-33,1%
-51,2%
1,640 bn €
49
Hedera Hashgraph - HBAR __1,607 bn €
0,1873 €
0,4%
0,6%
7,6%
-26,3%
27,3%
382,0%
-44,8%
1,607 bn €
50
Dash - DASH __
1,577 bn €
155,07 €
-0,6%
0,0%
5,7%
-56,3%
-13,6%
123,7%
21,7%
-88,3%
1,577 bn €
__ mehr anzeigen
Coin auswählen Bitcoin (BTC) Bitcoin (BTC) Ethereum (ETH)Tether (USDT)
Binance Coin (BNB)
Cardano (ADA)
Dogecoin (DOGE) XRP (XRP)Polkadot (DOT)
USD Coin (USDC)
Internet Computer (ICP) Uniswap (UNI) Bitcoin Cash (BCH)Chainlink (LINK)
Litecoin (LTC)
Solana (SOL)
Polygon (MATIC)
Binance USD (BUSD)
Theta Network (THETA) Stellar (XLM) VeChain (VET) Ethereum Classic (ETC) Wrapped Bitcoin (WBTC)Filecoin (FIL)
EOS (EOS) TRON (TRX)Monero (XMR)
Aave (AAVE)
Dai (DAI)
Shiba Inu (SHIB) NEO (NEO) Kusama (KSM) cETH (CETH)Cosmos (ATOM)
IOTA (MIOTA)
cDAI (CDAI)
Bitcoin SV (BSV)
Celsius Network (CEL)PancakeSwap (CAKE)
Maker (MKR)
cUSDC (CUSDC)
Klaytn (KLAY)
Crypto.com Coin (CRO)Algorand (ALGO)
FTX Token (FTT)
Tezos (XTZ)
Huobi Token (HT)
THORChain (RUNE)
BitTorrent (BTT)
Terra (LUNA)
LEO Token (LEO)
Betrag eingeben (optional) EUR __ Kryptobörsen vergleichen__ Optionen
Zahlungsmethoden:
Kreditkarte __
Überweisung __
Paypal __
Sofort __
Giropay __
Features:
Krypto Kreditkarte __Handy App __
Sparplan __
Krypto zu Krypto Tausch __Krypto Index __
Sprache:
Deutsche OberflächeDeutscher Support
Anbietertyp:
Direktkauf __
Börse __
Teil 1 Warum braucht die WeltKryptowährungen?
Teil 2 Sollte ich Kryptowährungenkaufen?
Teil 3 In welche Kryptowährungen sollte ich investieren? Teil 4 Wie kaufe ich Kryptowährungen? Teil 5 Wie verwende ich meineKryptowährungen?
Teil 6 Was kann ich mit meinen Kryptowährungen machen? Teil 7 Wie verwalte ich meine Kryptowährungen sicher? Teil 8 Ausblick in die ZukunftTOOLS & ANALYSEN
* Krypto Börsen Vergleich * Bitcoin Rainbow Chart* Flippening Index
* Altcoin Season Index* Correlation Study
* ROI Vergleich
* Bitcoin Rechner
* Crypto Heatmap
* Cryptocurrency World Map* Tweets in Charts
RATGEBER
* Kryptowährungen für Einsteiger* Hardware Wallets
* DeFi
* Ethereum 2.0
* Krypto Fonds
* Krypto Sparpläne
* Kryptowährungen versteuern * Zinsen auf Kryptowährungen * Bitcoin KreditkartenBEGRIFFE
* Decentralized Exchange (DEX)* DeFi
* dApps
* Distributed Ledger Technologie* Double Spending
* Fork
* FUD
* HODL
* Initial Coin Offerings * Consensus - Konsens * Marktkapitalisierung* Light Wallet
* Prediction Markets* Proof of Work
* Proof of Stake
* Security Token
* Smart Contracts
* Tangle
* The Flippening
* Token
WEITERE THEMEN SUCHEN BEITRÄGE AUS DEM BLOG BAGHOLDER GESUCHT! 200 EURO BELOHNUNG (PRO COIN)25. Mai 2021 -
Holger
ETHEREUM RAINBOW CHART3. Mai 2021
- Holger
DOGE RAINBOW CHART. WOW29. Januar 2021
- Holger
BITCOIN RAINBOW CHART (LIVE)28. Januar 2021
- Holger
11. Dezember 2020 - Holger Community Prognosen für 2021 9. September 2020 - Holger Bitcoin Supply – Visualized 14. Juni 2020 - Holger Cryptocurrency World Map – Search interest by country 20. April 2020 - Holger Cryptocurrency Correlation Study 20. März 2020 - Holger Bitcoin / DAX Vergleich 26. Februar 2020 - Holger Broker Gebührencheck: Tatsächlicher Bitcoin Preis 13. Januar 2020 - Holger Chartanalyse ist Bullshit! 27. Dezember 2019 - HolgerCrypto Heatmap
13. Dezember 2019 - Holger Community Prognosen für Kryptowährungen in 2020 16. Oktober 2019 - Holger What Google thinks about cryptocurrencies 24. Juni 2019 - Holger 72 Tipps für den Umgang mit Kryptowährungen 31. Mai 2019 - Holger Live-Blogging the “Value of Bitcoin” Conference Impressum | Datenschutz | Sitemap| Copyright © 2021
Disclaimer: Der Handel mit Kryptowährungen birgt ein hohes Risiko und kann bis zum Totalverlust des eingesetzten Kapitals führen. Keine der hier aufgeführten Informationen sind als Anlageberatatung zu verstehen. Alle genannten Kurse sind ohne Gewähr. Bitte beachten Sie dazu auch den den Haftungsausschluss im Impressum. Mit __ markierte Links sind 'Affiliate-Links', die uns dabei helfen diese Inhalte kostenfrei und ohne Werbebanner anbieten zu können.Details
6