6
More Annotations


4


2
Favourite Annotations


1


6
Text
U.S. BUREAU OF ECONOMIC ANALYSIS (BEA)DATATOOLSNEWSRESEARCHRESOURCESABOUT The first official Marine Economy Satellite Account statistics released today by the U.S. Bureau of Economic Analysis show that the marine economy accounted for 1.9 percent, or $397 billion, of current-dollar U.S. gross domestic product (GDP) in 2019 LOG IN | U.S. BUREAU OF ECONOMIC ANALYSIS (BEA) Bureau of Economic Analysis 4600 Silver Hill Road • Suitland, MD 20746 . Contact Us; Working at BEA; Frequently Asked Questions; Our
Policies; Privacy
HOW ARE FEDERAL ECONOMIC IMPACT PAYMENTS TO SUPPORT The Coronavirus Aid, Relief and Economic Security Act of 2020 provided $300 billion in direct support through economic impact payments to individuals, including advance tax rebate payments distributed mostly in April 2020. A $1,200 refundable tax credit was provided to individuals ($2,400 for joint taxpayers) that meet specified criteria. In addition, qualified taxpayers with children received EMPLOYMENT BY COUNTY, METRO, AND OTHER AREAS BEA produces job counts for local areas, with breakdowns by industry. The employment estimates include data for: counties, metropolitan statistical areas, micropolitan statistical areas, combined statistical areas, and metropolitan divisions. INTERNATIONAL SURVEYS: FOREIGN DIRECT INVESTMENT IN THE BEA's surveys of foreign direct investment (FDI) in the United States collect information that is used to compile statistics on the scale of foreign-owned business activities in the United States and the effects these activities have on the U.S. economy. Business leaders look tothese statistics to
BE-10 BENCHMARK SURVEY: U.S. DIRECT INVESTMENT ABROAD BE-10 reports for 2019 are due: May 29, 2020 for a U.S. Reporter required to file fewer than 50 Forms BE-10B, BE-10C, and/or BE-10D. June 30, 2020 for a U.S. Reporter required to file 50 or more Forms BE-10B, BE-10C, and/or BE-10D. 2020 ANNUAL SURVEY OF U.S. DIRECT INVESTMENT ABROAD be-11 instructions (rev. 12/2020) omb no. 0608-0053: approval expires 10/31/2021 u.s. department of commerce bureau of economic analysis 2020 annual survey of u.s. direct investment abroad PERSONAL CONSUMPTION EXPENDITURES PRICE INDEX A measure of the prices that people living in the United States, or those buying on their behalf, pay for goods and services. The PCE price index is known for capturing inflation (or deflation) across a wide range of consumer expenses and reflecting changes in consumerbehavior.
HOW DO I SUBMIT MY REPORT THROUGH THE BEA EFILE SYSTEM Scroll down the Survey Homepage to reach the available filing periods for the entity. Select the filing period to be completed. This will take you to the eFile – Report Homepage. Scroll down the Report Homepage to access options for determining form type and downloading the PDF survey form for completion and submission. CAN I SUBMIT THE BE-125 ELECTRONICALLY? Yes, you may file electronically at http://www.bea.gov/efile. This system allows you to access a fillable PDF version of the BE-125; you may work on the survey over U.S. BUREAU OF ECONOMIC ANALYSIS (BEA)DATATOOLSNEWSRESEARCHRESOURCESABOUT The first official Marine Economy Satellite Account statistics released today by the U.S. Bureau of Economic Analysis show that the marine economy accounted for 1.9 percent, or $397 billion, of current-dollar U.S. gross domestic product (GDP) in 2019 LOG IN | U.S. BUREAU OF ECONOMIC ANALYSIS (BEA) Bureau of Economic Analysis 4600 Silver Hill Road • Suitland, MD 20746 . Contact Us; Working at BEA; Frequently Asked Questions; OurPolicies; Privacy
HOW ARE FEDERAL ECONOMIC IMPACT PAYMENTS TO SUPPORT The Coronavirus Aid, Relief and Economic Security Act of 2020 provided $300 billion in direct support through economic impact payments to individuals, including advance tax rebate payments distributed mostly in April 2020. A $1,200 refundable tax credit was provided to individuals ($2,400 for joint taxpayers) that meet specified criteria. In addition, qualified taxpayers with children received EMPLOYMENT BY COUNTY, METRO, AND OTHER AREAS BEA produces job counts for local areas, with breakdowns by industry. The employment estimates include data for: counties, metropolitan statistical areas, micropolitan statistical areas, combined statistical areas, and metropolitan divisions. INTERNATIONAL SURVEYS: FOREIGN DIRECT INVESTMENT IN THE BEA's surveys of foreign direct investment (FDI) in the United States collect information that is used to compile statistics on the scale of foreign-owned business activities in the United States and the effects these activities have on the U.S. economy. Business leaders look tothese statistics to
BE-10 BENCHMARK SURVEY: U.S. DIRECT INVESTMENT ABROAD BE-10 reports for 2019 are due: May 29, 2020 for a U.S. Reporter required to file fewer than 50 Forms BE-10B, BE-10C, and/or BE-10D. June 30, 2020 for a U.S. Reporter required to file 50 or more Forms BE-10B, BE-10C, and/or BE-10D. 2020 ANNUAL SURVEY OF U.S. DIRECT INVESTMENT ABROAD be-11 instructions (rev. 12/2020) omb no. 0608-0053: approval expires 10/31/2021 u.s. department of commerce bureau of economic analysis 2020 annual survey of u.s. direct investment abroad PERSONAL CONSUMPTION EXPENDITURES PRICE INDEX A measure of the prices that people living in the United States, or those buying on their behalf, pay for goods and services. The PCE price index is known for capturing inflation (or deflation) across a wide range of consumer expenses and reflecting changes in consumerbehavior.
HOW DO I SUBMIT MY REPORT THROUGH THE BEA EFILE SYSTEM Scroll down the Survey Homepage to reach the available filing periods for the entity. Select the filing period to be completed. This will take you to the eFile – Report Homepage. Scroll down the Report Homepage to access options for determining form type and downloading the PDF survey form for completion and submission. CAN I SUBMIT THE BE-125 ELECTRONICALLY? Yes, you may file electronically at http://www.bea.gov/efile. This system allows you to access a fillable PDF version of the BE-125; you may work on the survey over BEA DATA | U.S. BUREAU OF ECONOMIC ANALYSIS (BEA) To find a statistic, or to explore BEA's data, start with one of thegroupings below.
GDP BY STATE
Real gross domestic product (GDP) increased in all 50 states and the District of Columbia in the fourth quarter of 2020, as real GDP for the nation increased at an annual rate of 4.3 percent. The percent change in real GDP in the fourth quarter ranged from 9.9 percent in South Dakota to 1.2 percent in the District of Columbia. CurrentRelease.
CONSUMER SPENDING
December 2020. -0.6 percent. Consumer spending, or personal consumption expenditures (PCE), is the value of the goods and services purchased by, or on the behalf of, U.S. residents. At the national level, BEA publishes annual, quarterly, and monthly estimates of consumer spending. Current Release. Quick Guide: Personal Income andOutlays Releases.
U.S. INTERNATIONAL TRADE IN GOODS AND SERVICES, APRIL 2021 The global pandemic and the economic recovery continued to impact international trade in April 2021. The full economic effects of the pandemic cannot be quantified in the statistics because the impacts are generally embedded in source data and cannot be separatelyidentified.
INTERNATIONAL SURVEYS: FOREIGN DIRECT INVESTMENT IN THE BEA's surveys of foreign direct investment (FDI) in the United States collect information that is used to compile statistics on the scale of foreign-owned business activities in the United States and the effects these activities have on the U.S. economy. Business leaders look tothese statistics to
PERSONAL SAVING RATE February 2021. +13.9%. January 2021. +20.0%. December 2020. +13.5%. The U.S. personal saving rate is personal saving as a percentage of disposable personal income. In other words, it's the percentage of people's incomes left after they pay taxes and spend money. CurrentRelease.
HOW ARE FEDERAL ECONOMIC IMPACT PAYMENTS TO SUPPORT The Coronavirus Aid, Relief and Economic Security Act of 2020 provided $300 billion in direct support through economic impact payments to individuals, including advance tax rebate payments distributed mostly in April 2020. A $1,200 refundable tax credit was provided to individuals ($2,400 for joint taxpayers) that meet specified criteria. In addition, qualified taxpayers with children received INTERNATIONAL SURVEYS: U.S. DIRECT INVESTMENT ABROAD BEA uses surveys to collect data about U.S.-owned business activities in other countries. The data are needed for statistics measuring the scale of direct investment abroad and the effects these activities have on the U.S. economy. Data from these surveys contribute to many of BEA's international and national economic statistics and helpanswer
REGIONAL PRICE PARITIES BY STATE AND METRO AREA Regional Price Parities. Regional price parities (RPPs) measure the differences in price levels across states and metropolitan areas for a given year and are expressed as a percentage of the overall national price level. In 2019, states with the highest RPPs were Hawaii (119.3), California (116.4), and New York (116.3). DEFINING AND MEASURING THE U.S. OCEAN ECONOMY Defining and Measuring the U.S. Ocean Economy Authors William Nicolls, primary author; Connor Franks, Teresa Gilmore, Rachel Goulder, Luke Mendelsohn, and Edward Morgan, Bureau of Economic Analysis Jeffery Adkins, Monica Grasso, Kate Quigley, and Jennifer Zhuang, U.S. BUREAU OF ECONOMIC ANALYSIS (BEA)DATATOOLSNEWSRESEARCHRESOURCESABOUT The first official Marine Economy Satellite Account statistics released today by the U.S. Bureau of Economic Analysis show that the marine economy accounted for 1.9 percent, or $397 billion, of current-dollar U.S. gross domestic product (GDP) in 2019 LOG IN | U.S. BUREAU OF ECONOMIC ANALYSIS (BEA) Bureau of Economic Analysis 4600 Silver Hill Road • Suitland, MD 20746 . Contact Us; Working at BEA; Frequently Asked Questions; OurPolicies; Privacy
PERSONAL SAVING RATE February 2021. +13.9%. January 2021. +20.0%. December 2020. +13.5%. The U.S. personal saving rate is personal saving as a percentage of disposable personal income. In other words, it's the percentage of people's incomes left after they pay taxes and spend money. CurrentRelease.
EMPLOYMENT BY COUNTY, METRO, AND OTHER AREAS BEA produces job counts for local areas, with breakdowns by industry. The employment estimates include data for: counties, metropolitan statistical areas, micropolitan statistical areas, combined statistical areas, and metropolitan divisions. INTERNATIONAL SURVEYS: FOREIGN DIRECT INVESTMENT IN THE BEA's surveys of foreign direct investment (FDI) in the United States collect information that is used to compile statistics on the scale of foreign-owned business activities in the United States and the effects these activities have on the U.S. economy. Business leaders look tothese statistics to
BE-10 BENCHMARK SURVEY: U.S. DIRECT INVESTMENT ABROAD BE-10 reports for 2019 are due: May 29, 2020 for a U.S. Reporter required to file fewer than 50 Forms BE-10B, BE-10C, and/or BE-10D. June 30, 2020 for a U.S. Reporter required to file 50 or more Forms BE-10B, BE-10C, and/or BE-10D. COUNTY, METRO AND OTHER LOCAL AREAS Note: GDP by County is now part of GDP by County, Metro, and Other Areas. Wages, proprietors' income, dividends, interest, rents, and other income received by local residents. Personal income adjusted for state and metro area price level differences and national inflation. Measure price levels that can be compared across states or metroareas.
2020 ANNUAL SURVEY OF FOREIGN DIRECT INVESTMENT IN … 2020 ANNUAL SURVEY OF FOREIGN DIRECT INVESTMENT IN THE UNITED STATES MANDATORY – CONFIDENTIAL FORM BE–15C BEA-12 Identification Number FORM BE-15C (REV 10/2020) OMB No. 0608-0034: Approval Expires 10/12/2021 BE-15 Identification Number PERSONAL CONSUMPTION EXPENDITURES PRICE INDEX A measure of the prices that people living in the United States, or those buying on their behalf, pay for goods and services. The PCE price index is known for capturing inflation (or deflation) across a wide range of consumer expenses and reflecting changes in consumerbehavior.
QUARTERLY SURVEY OF FOREIGN AIRLINE OPERATORS’ … Page 4 FORM BE-9 (REV. 08/2016) Part III – Foreign Airline Operators’ Revenues and Expenses in the United States IMPORTANT – Report amounts in thousands of U.S. dollars (omitting 000). Round amounts of less than $500 to 0. Do not enter amounts in the shaded portion of each item. U.S. BUREAU OF ECONOMIC ANALYSIS (BEA)DATATOOLSNEWSRESEARCHRESOURCESABOUT The first official Marine Economy Satellite Account statistics released today by the U.S. Bureau of Economic Analysis show that the marine economy accounted for 1.9 percent, or $397 billion, of current-dollar U.S. gross domestic product (GDP) in 2019 LOG IN | U.S. BUREAU OF ECONOMIC ANALYSIS (BEA) Bureau of Economic Analysis 4600 Silver Hill Road • Suitland, MD 20746 . Contact Us; Working at BEA; Frequently Asked Questions; OurPolicies; Privacy
PERSONAL SAVING RATE February 2021. +13.9%. January 2021. +20.0%. December 2020. +13.5%. The U.S. personal saving rate is personal saving as a percentage of disposable personal income. In other words, it's the percentage of people's incomes left after they pay taxes and spend money. CurrentRelease.
EMPLOYMENT BY COUNTY, METRO, AND OTHER AREAS BEA produces job counts for local areas, with breakdowns by industry. The employment estimates include data for: counties, metropolitan statistical areas, micropolitan statistical areas, combined statistical areas, and metropolitan divisions. INTERNATIONAL SURVEYS: FOREIGN DIRECT INVESTMENT IN THE BEA's surveys of foreign direct investment (FDI) in the United States collect information that is used to compile statistics on the scale of foreign-owned business activities in the United States and the effects these activities have on the U.S. economy. Business leaders look tothese statistics to
BE-10 BENCHMARK SURVEY: U.S. DIRECT INVESTMENT ABROAD BE-10 reports for 2019 are due: May 29, 2020 for a U.S. Reporter required to file fewer than 50 Forms BE-10B, BE-10C, and/or BE-10D. June 30, 2020 for a U.S. Reporter required to file 50 or more Forms BE-10B, BE-10C, and/or BE-10D. COUNTY, METRO AND OTHER LOCAL AREAS Note: GDP by County is now part of GDP by County, Metro, and Other Areas. Wages, proprietors' income, dividends, interest, rents, and other income received by local residents. Personal income adjusted for state and metro area price level differences and national inflation. Measure price levels that can be compared across states or metroareas.
2020 ANNUAL SURVEY OF FOREIGN DIRECT INVESTMENT IN … 2020 ANNUAL SURVEY OF FOREIGN DIRECT INVESTMENT IN THE UNITED STATES MANDATORY – CONFIDENTIAL FORM BE–15C BEA-12 Identification Number FORM BE-15C (REV 10/2020) OMB No. 0608-0034: Approval Expires 10/12/2021 BE-15 Identification Number PERSONAL CONSUMPTION EXPENDITURES PRICE INDEX A measure of the prices that people living in the United States, or those buying on their behalf, pay for goods and services. The PCE price index is known for capturing inflation (or deflation) across a wide range of consumer expenses and reflecting changes in consumerbehavior.
QUARTERLY SURVEY OF FOREIGN AIRLINE OPERATORS’ … Page 4 FORM BE-9 (REV. 08/2016) Part III – Foreign Airline Operators’ Revenues and Expenses in the United States IMPORTANT – Report amounts in thousands of U.S. dollars (omitting 000). Round amounts of less than $500 to 0. Do not enter amounts in the shaded portion of each item. BEA DATA | U.S. BUREAU OF ECONOMIC ANALYSIS (BEA) To find a statistic, or to explore BEA's data, start with one of thegroupings below.
APRIL 2021 TRADE GAP IS $68.9 BILLION The U.S. monthly international trade deficit decreased in April 2021 according to the U.S. Bureau of Economic Analysis and the U.S. Census Bureau. The deficit decreased from $75.0 billion in March (revised) to $68.9 billion in April, as exports increased and imports decreased. The previously published March deficit was $74.4 billion. The goods deficit decreased $6.2 billion in April to $86.7GDP BY STATE
Real gross domestic product (GDP) increased in all 50 states and the District of Columbia in the fourth quarter of 2020, as real GDP for the nation increased at an annual rate of 4.3 percent. The percent change in real GDP in the fourth quarter ranged from 9.9 percent in South Dakota to 1.2 percent in the District of Columbia. CurrentRelease.
U.S. INTERNATIONAL TRADE IN GOODS AND SERVICES, APRIL 2021 The global pandemic and the economic recovery continued to impact international trade in April 2021. The full economic effects of the pandemic cannot be quantified in the statistics because the impacts are generally embedded in source data and cannot be separatelyidentified.
CONSUMER SPENDING
December 2020. -0.6 percent. Consumer spending, or personal consumption expenditures (PCE), is the value of the goods and services purchased by, or on the behalf of, U.S. residents. At the national level, BEA publishes annual, quarterly, and monthly estimates of consumer spending. Current Release. Quick Guide: Personal Income andOutlays Releases.
PERSONAL SAVING RATE February 2021. +13.9%. January 2021. +20.0%. December 2020. +13.5%. The U.S. personal saving rate is personal saving as a percentage of disposable personal income. In other words, it's the percentage of people's incomes left after they pay taxes and spend money. CurrentRelease.
COUNTY, METRO AND OTHER LOCAL AREAS Note: GDP by County is now part of GDP by County, Metro, and Other Areas. Wages, proprietors' income, dividends, interest, rents, and other income received by local residents. Personal income adjusted for state and metro area price level differences and national inflation. Measure price levels that can be compared across states or metroareas.
PERSONAL INCOME BY COUNTY, METRO, AND OTHER AREAS Personal Income by County and Metropolitan Area, 2019. In 2019, personal income increased in 2,964 counties, decreased in 139, and was unchanged in 10. Personal income increased 4.0 percent in the metropolitan portion of the United States and increased 3.5 percent in the nonmetropolitan portion. Current Release. Current Release:November 17, 2020.
CAN I SUBMIT THE BE-125 ELECTRONICALLY? Yes, you may file electronically at http://www.bea.gov/efile. This system allows you to access a fillable PDF version of the BE-125; you may work on the survey over DEFINING AND MEASURING THE U.S. OCEAN ECONOMY Defining and Measuring the U.S. Ocean Economy Authors William Nicolls, primary author; Connor Franks, Teresa Gilmore, Rachel Goulder, Luke Mendelsohn, and Edward Morgan, Bureau of Economic Analysis Jeffery Adkins, Monica Grasso, Kate Quigley, and Jennifer Zhuang, U.S. BUREAU OF ECONOMIC ANALYSIS (BEA)DATATOOLSNEWSRESEARCHRESOURCESABOUT Personal income decreased $3.21 trillion, or 13.1 percent at a monthly rate, while consumer spending increased $80.3 billion, or 0.5 percent, in April. Economic impact payments established by the American Rescue Plan Act, declined sharply in April LOG IN | U.S. BUREAU OF ECONOMIC ANALYSIS (BEA) Bureau of Economic Analysis 4600 Silver Hill Road • Suitland, MD 20746 . Contact Us; Working at BEA; Frequently Asked Questions; OurPolicies; Privacy
PERSONAL SAVING RATE February 2021. +13.9%. January 2021. +20.0%. December 2020. +13.5%. The U.S. personal saving rate is personal saving as a percentage of disposable personal income. In other words, it's the percentage of people's incomes left after they pay taxes and spend money. CurrentRelease.
INTERNATIONAL SURVEYS: FOREIGN DIRECT INVESTMENT IN THE BEA's surveys of foreign direct investment (FDI) in the United States collect information that is used to compile statistics on the scale of foreign-owned business activities in the United States and the effects these activities have on the U.S. economy. Business leaders look tothese statistics to
2020 ANNUAL SURVEY OF U.S. DIRECT INVESTMENT ABROAD be-11 instructions (rev. 12/2020) omb no. 0608-0053: approval expires 10/31/2021 u.s. department of commerce bureau of economic analysis 2020 annual survey of u.s. direct investment abroad PERSONAL CONSUMPTION EXPENDITURES PRICE INDEX A measure of the prices that people living in the United States, or those buying on their behalf, pay for goods and services. The PCE price index is known for capturing inflation (or deflation) across a wide range of consumer expenses and reflecting changes in consumerbehavior.
EMPLOYMENT BY COUNTY, METRO, AND OTHER AREAS BEA produces job counts for local areas, with breakdowns by industry. The employment estimates include data for: counties, metropolitan statistical areas, micropolitan statistical areas, combined statistical areas, and metropolitan divisions. 2020 ANNUAL SURVEY OF FOREIGN DIRECT INVESTMENT IN … 2020 ANNUAL SURVEY OF FOREIGN DIRECT INVESTMENT IN THE UNITED STATES MANDATORY – CONFIDENTIAL FORM BE–15C BEA-12 Identification Number FORM BE-15C (REV 10/2020) OMB No. 0608-0034: Approval Expires 10/12/2021 BE-15 Identification Number COUNTY, METRO AND OTHER LOCAL AREAS Note: GDP by County is now part of GDP by County, Metro, and Other Areas. Wages, proprietors' income, dividends, interest, rents, and other income received by local residents. Personal income adjusted for state and metro area price level differences and national inflation. Measure price levels that can be compared across states or metroareas.
2020 ANNUAL SURVEY OF FOREIGN DIRECT INVESTMENT IN … FORM BE-15 Claim for Exemption (REV 10/2020) OMB No. 0608-0034: Approval Expires 10/12/2021 BE-15 Identification Number Response Required All persons who are contacted by BEA about reporting in this survey, either by sending them forms or by written inquiry, mustrespond pursuant to
U.S. BUREAU OF ECONOMIC ANALYSIS (BEA)DATATOOLSNEWSRESEARCHRESOURCESABOUT Personal income decreased $3.21 trillion, or 13.1 percent at a monthly rate, while consumer spending increased $80.3 billion, or 0.5 percent, in April. Economic impact payments established by the American Rescue Plan Act, declined sharply in April LOG IN | U.S. BUREAU OF ECONOMIC ANALYSIS (BEA) Bureau of Economic Analysis 4600 Silver Hill Road • Suitland, MD 20746 . Contact Us; Working at BEA; Frequently Asked Questions; OurPolicies; Privacy
PERSONAL SAVING RATE February 2021. +13.9%. January 2021. +20.0%. December 2020. +13.5%. The U.S. personal saving rate is personal saving as a percentage of disposable personal income. In other words, it's the percentage of people's incomes left after they pay taxes and spend money. CurrentRelease.
INTERNATIONAL SURVEYS: FOREIGN DIRECT INVESTMENT IN THE BEA's surveys of foreign direct investment (FDI) in the United States collect information that is used to compile statistics on the scale of foreign-owned business activities in the United States and the effects these activities have on the U.S. economy. Business leaders look tothese statistics to
2020 ANNUAL SURVEY OF U.S. DIRECT INVESTMENT ABROAD be-11 instructions (rev. 12/2020) omb no. 0608-0053: approval expires 10/31/2021 u.s. department of commerce bureau of economic analysis 2020 annual survey of u.s. direct investment abroad PERSONAL CONSUMPTION EXPENDITURES PRICE INDEX A measure of the prices that people living in the United States, or those buying on their behalf, pay for goods and services. The PCE price index is known for capturing inflation (or deflation) across a wide range of consumer expenses and reflecting changes in consumerbehavior.
EMPLOYMENT BY COUNTY, METRO, AND OTHER AREAS BEA produces job counts for local areas, with breakdowns by industry. The employment estimates include data for: counties, metropolitan statistical areas, micropolitan statistical areas, combined statistical areas, and metropolitan divisions. 2020 ANNUAL SURVEY OF FOREIGN DIRECT INVESTMENT IN … 2020 ANNUAL SURVEY OF FOREIGN DIRECT INVESTMENT IN THE UNITED STATES MANDATORY – CONFIDENTIAL FORM BE–15C BEA-12 Identification Number FORM BE-15C (REV 10/2020) OMB No. 0608-0034: Approval Expires 10/12/2021 BE-15 Identification Number COUNTY, METRO AND OTHER LOCAL AREAS Note: GDP by County is now part of GDP by County, Metro, and Other Areas. Wages, proprietors' income, dividends, interest, rents, and other income received by local residents. Personal income adjusted for state and metro area price level differences and national inflation. Measure price levels that can be compared across states or metroareas.
2020 ANNUAL SURVEY OF FOREIGN DIRECT INVESTMENT IN … FORM BE-15 Claim for Exemption (REV 10/2020) OMB No. 0608-0034: Approval Expires 10/12/2021 BE-15 Identification Number Response Required All persons who are contacted by BEA about reporting in this survey, either by sending them forms or by written inquiry, mustrespond pursuant to
BEA DATA | U.S. BUREAU OF ECONOMIC ANALYSIS (BEA) To find a statistic, or to explore BEA's data, start with one of thegroupings below.
APRIL 2021 TRADE GAP IS $68.9 BILLION The U.S. monthly international trade deficit decreased in April 2021 according to the U.S. Bureau of Economic Analysis and the U.S. Census Bureau. The deficit decreased from $75.0 billion in March (revised) to $68.9 billion in April, as exports increased and imports decreased. The previously published March deficit was $74.4 billion. The goods deficit decreased $6.2 billion in April to $86.7 U.S. INTERNATIONAL TRADE IN GOODS AND SERVICES, APRIL 2021 The global pandemic and the economic recovery continued to impact international trade in April 2021. The full economic effects of the pandemic cannot be quantified in the statistics because the impacts are generally embedded in source data and cannot be separatelyidentified.
GDP BY STATE
Real gross domestic product (GDP) increased in all 50 states and the District of Columbia in the fourth quarter of 2020, as real GDP for the nation increased at an annual rate of 4.3 percent. The percent change in real GDP in the fourth quarter ranged from 9.9 percent in South Dakota to 1.2 percent in the District of Columbia. CurrentRelease.
COUNTY, METRO AND OTHER LOCAL AREAS Note: GDP by County is now part of GDP by County, Metro, and Other Areas. Wages, proprietors' income, dividends, interest, rents, and other income received by local residents. Personal income adjusted for state and metro area price level differences and national inflation. Measure price levels that can be compared across states or metroareas.
PERSONAL INCOME BY STATE State Annual Personal Income, 2020 (Preliminary) and State Quarterly Personal Income, 4th Quarter 2020. State personal income increased 6.1 percent in 2020 after increasing 3.9 percent in 2019. In 2020, the increase in transfer receipts was the leading contributor to personal income growth in all states and the District of Columbia. CONTACT US | U.S. BUREAU OF ECONOMIC ANALYSIS (BEA) Mailing Address USPS Bureau of Economic Analysis (BEA) 4600 Silver Hill Rd. Washington, DC 20233 Shipping Address FedEx, UPS, etc. Bureau of Economic Analysis (BEA) 4600 Silver Hill Rd. MARINE ECONOMY SATELLITE ACCOUNT, 2014-2019 The first official Marine Economy Satellite Account statistics released today by the U.S. Bureau of Economic Analysis show that the marine economy accounted for 1.9 percent, or $397 billion, of current-dollar U.S. gross domestic product in 2019. The new statistics show that inflation-adjusted (real) GDP for the marine economy grew 4.2 percent in 2019, faster than the 2.2 percent growth for the CAN I SUBMIT THE BE-125 ELECTRONICALLY? Yes, you may file electronically at http://www.bea.gov/efile. This system allows you to access a fillable PDF version of the BE-125; you may work on the survey over DEFINING AND MEASURING THE U.S. OCEAN ECONOMY Defining and Measuring the U.S. Ocean Economy Authors William Nicolls, primary author; Connor Franks, Teresa Gilmore, Rachel Goulder, Luke Mendelsohn, and Edward Morgan, Bureau of Economic Analysis Jeffery Adkins, Monica Grasso, Kate Quigley, and Jennifer Zhuang, Skip to main content An official website of the United States governmentToggle navigation
MAIN NAVIGATION
* Data
* by Topic
* by Place
* by Economic Account* Tools
* Interactive Data
* Application Programming Interface (API)* Country Facts
* BEARFACTS
* Industry Facts
* GDP & Personal Income Mapping* RIMS II
* eFile
* News
* Economy at a Glance* News Releases
* Release Schedule
* The BEA Wire | BEA's Official Blog * Survey of Current Business* Archive
* For Journalists
* Research
* Offices of Research * Meet the Researchers* Papers
* Special Sworn Researcher Program * Research Using Company-Level Data * Fellowship Program* Resources
* Learning Center
* Methodologies
* Multimedia
* Article Collections * For Congressional Users* For Developers
* For Students
* About
* Who We Are
* BEA Leadership
* Advisory Committees * Budget and Performance * Policies and Information* Working at BEA
* Help
* Contact Us
* Ask an Expert
* For Survey Respondents * Frequently Asked Questions (FAQ)* Glossary
* Guidelines for Citing BEA BUREAU OF ECONOMIC ANALYSISMay 28, 2021
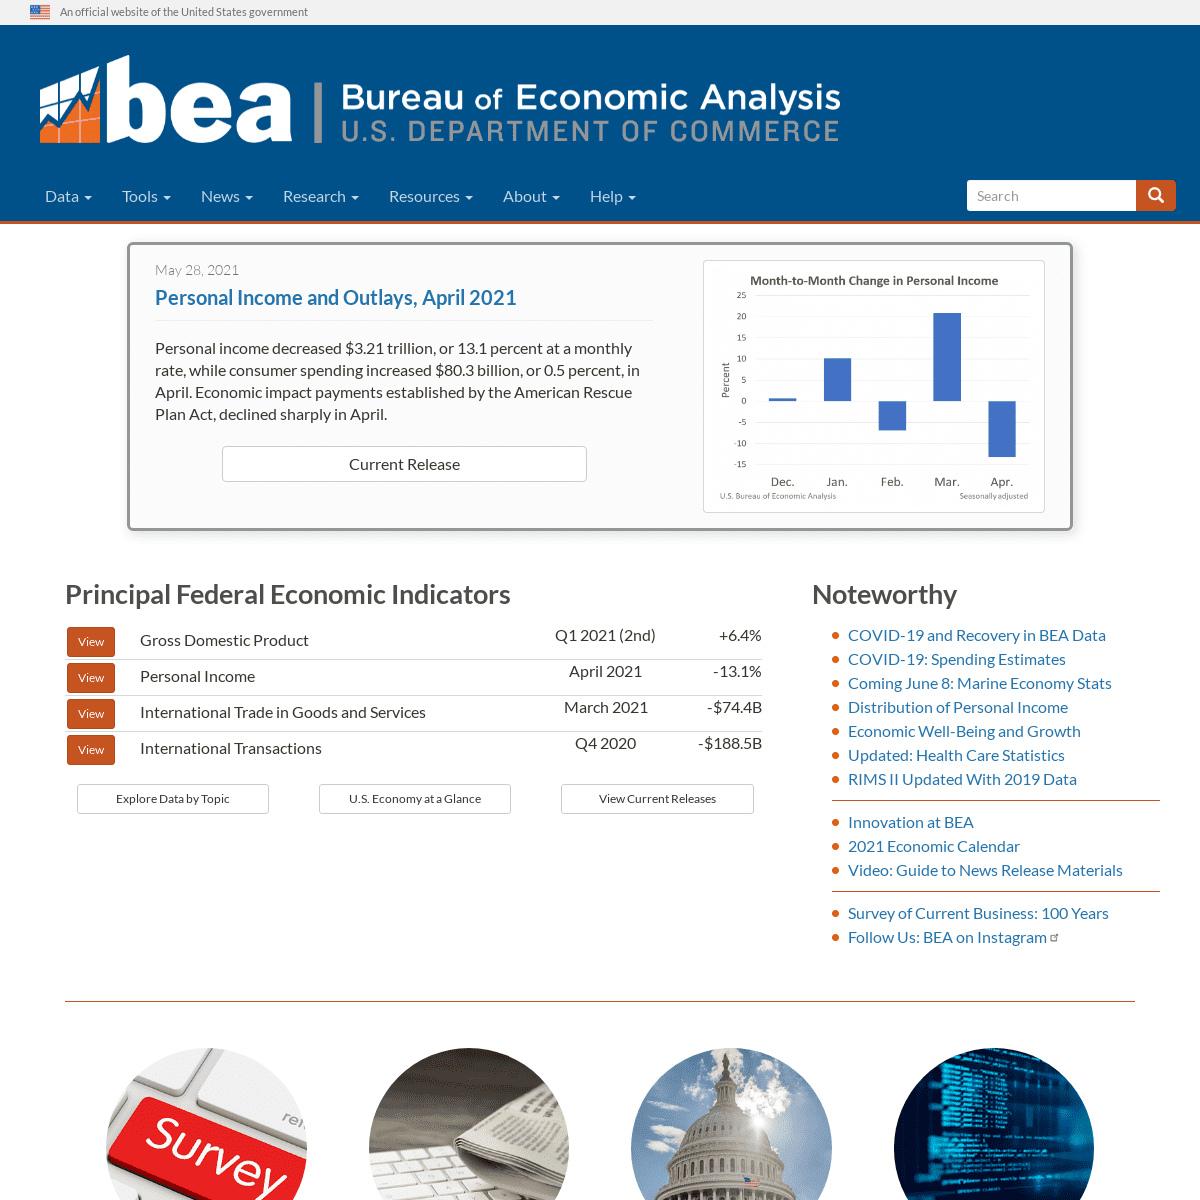
PERSONAL INCOME AND OUTLAYS, APRIL 2021 Personal income decreased $3.21 trillion, or 13.1 percent at a monthly rate, while consumer spending increased $80.3 billion, or 0.5 percent, in April. Economic impact payments established by the American Rescue Plan Act, declined sharply in April.Current Release
PERSONAL INCOME AND OUTLAYS, APRIL '21 CHART PRINCIPAL FEDERAL ECONOMIC INDICATORSView
Gross Domestic ProductQ1 2021 (2nd)
+6.4%
View
Personal Income
April 2021
-13.1%
View
International Trade in Goods and ServicesMarch 2021
-$74.4B
View
International TransactionsQ4 2020
-$188.5B
Explore Data by Topic U.S. Economy at a Glance View Current ReleasesNOTEWORTHY
* COVID-19 and Recovery in BEA Data * COVID-19: Spending Estimates * Coming June 8: Marine Economy Stats * Distribution of Personal Income * Economic Well-Being and Growth * Updated: Health Care Statistics * RIMS II Updated With 2019 Data* Innovation at BEA
* 2021 Economic Calendar * Video: Guide to News Release Materials * Survey of Current Business: 100 Years * Follow Us: BEA on Instagram (link is external) ------------------------- HELP FOR SURVEY RESPONDENTS NEWS FOR JOURNALISTS RESOURCES FOR CONGRESSIONAL USERS RESOURCES FOR DEVELOPERSINFORMATION FOR
Details
5