5
More Annotations


6


5
Favourite Annotations


1


3
Text
FSC - STREAMING STOCK CHARTSPLATFORM V1TC2000PREMIUM SERVICESSUPPORTSERVERMONITOR The green zone represents a profit of up to $1000. The breakeven levels are $297.18 and $273.75. The red zones show unlimited loss to the up and downside. As you slide the strike price lines on the chart and move through expiration dates, the P&L zones are updated dynamically making it FREESTOCKCHARTS FOR MAC, MOBILE & WEB CLIENT This is the full version of FreeStockCharts powered by TC2000, the award-winning software for stock & option traders. There is no additional cost to access FreeStockCharts from a
DOWNLOAD SOFTWARE
TC2000 platform & data subscriptions are offered by TC2000 Software Company ("TCS"). Securities brokerage services are offered by TC2000 Brokerage, Inc. ("TCB"), a registered broker dealer, member FINRA/SIPC.TCS and TCB are separate companies affiliated throughcommon ownership.
WWW.FREESTOCKCHARTS.COM www.freestockcharts.comWELCOME
Welcome . Welcome to FreeStockCharts.com where the charts are free, the data is streaming in real-time and the features beat expensivetrading platforms.
US MARKET INDICATORS US Market Indicators. Worden’s Market Indicators, known as T2s because each symbol begins with T2, are calculated using the daily market activity of the NYSE.STOCHASTICS
Stochastics was developed by George C. Lane and is calculated as follows: K = ( (C - Ln)/ (Hn - Ln)) * 100. Where. K is Lane's Stochastics. C is the latest closing price of the stock. L is the n-period low price of the stock. H is the n-period high price of the stock. n can be any number (Lane suggests 5 to 21) RSI AND WILDER'S RSI RSI and Wilder's RSI. RSI is a momentum oscillator that compares the magnitude of a stock's recent gains to the magnitude of its recent losses and turns that information into a VWAP AND MOVING VWAP VWAP and Moving VWAP. VWAP is a trading acronym for Volume-Weighted Average Price, the ratio of the value traded to total volume traded over a particular time horizon (usually one day).BOLLINGER BANDS®
Bollinger Bands® Bollinger Bands were created by John A. Bollinger. They compare volatility and relative price levels over a period time. The indicator consists of three bands designed to encompass the majority of a security's price action: a Moving Average in the middle, an upper band (MA plus x -standard deviations) and a lower band (MA minus x standard deviations). FSC - STREAMING STOCK CHARTSPLATFORM V1TC2000PREMIUM SERVICESSUPPORTSERVERMONITOR The green zone represents a profit of up to $1000. The breakeven levels are $297.18 and $273.75. The red zones show unlimited loss to the up and downside. As you slide the strike price lines on the chart and move through expiration dates, the P&L zones are updated dynamically making it FREESTOCKCHARTS FOR MAC, MOBILE & WEB CLIENT This is the full version of FreeStockCharts powered by TC2000, the award-winning software for stock & option traders. There is no additional cost to access FreeStockCharts from aDOWNLOAD SOFTWARE
TC2000 platform & data subscriptions are offered by TC2000 Software Company ("TCS"). Securities brokerage services are offered by TC2000 Brokerage, Inc. ("TCB"), a registered broker dealer, member FINRA/SIPC.TCS and TCB are separate companies affiliated throughcommon ownership.
WWW.FREESTOCKCHARTS.COM www.freestockcharts.comWELCOME
Welcome . Welcome to FreeStockCharts.com where the charts are free, the data is streaming in real-time and the features beat expensivetrading platforms.
US MARKET INDICATORS US Market Indicators. Worden’s Market Indicators, known as T2s because each symbol begins with T2, are calculated using the daily market activity of the NYSE.STOCHASTICS
Stochastics was developed by George C. Lane and is calculated as follows: K = ( (C - Ln)/ (Hn - Ln)) * 100. Where. K is Lane's Stochastics. C is the latest closing price of the stock. L is the n-period low price of the stock. H is the n-period high price of the stock. n can be any number (Lane suggests 5 to 21) RSI AND WILDER'S RSI RSI and Wilder's RSI. RSI is a momentum oscillator that compares the magnitude of a stock's recent gains to the magnitude of its recent losses and turns that information into a VWAP AND MOVING VWAP VWAP and Moving VWAP. VWAP is a trading acronym for Volume-Weighted Average Price, the ratio of the value traded to total volume traded over a particular time horizon (usually one day).BOLLINGER BANDS®
Bollinger Bands® Bollinger Bands were created by John A. Bollinger. They compare volatility and relative price levels over a period time. The indicator consists of three bands designed to encompass the majority of a security's price action: a Moving Average in the middle, an upper band (MA plus x -standard deviations) and a lower band (MA minus x standard deviations). WWW.FREESTOCKCHARTS.COM www.freestockcharts.comFREESTOCKCHARTS
FSC Premium is no longer available. Please visit TC2000 to learn more about the latest software releases. Visit TC2000.MOVING AVERAGE
Moving Average. Moving averages are used to smooth trends. FreeStockCharts.com offers three different types of moving averages.. Simple. A simple moving average gives equal weight to each data pointfor the period.
FREESTOCKCHARTS.COM
FreeStockCharts.com - Alerts & Reminders PLOT STYLE - FREESTOCKCHARTS Line. Plots a line connecting the closing value of each period (daily, weekly, etc.) OHLC Bar. Short for "Open, High, Low, Close", this plot style shows the open, high, low DRAWING TOOL SETTINGS Drawing Tool Settings. When you draw a trendline, Fibonacci fan or text annotation on a chart, the program remembers both they symbol you drew it on and the chart you drew it on.CANDLESTICK CHARTS
Candlestick charts. You change the price plot style to Candlesticks by clicking the Settings button at the top of the chart or by clicking Price History, then Edit.WILLIAMS ALLIGATOR
Williams Alligator "Most of the time the market remains stationary. Only for some 15–30% of time the market generates trends, and traders who are not located in the exchange itself derive most of their profits from the trends.YOUR SEARCH FOR
An email has been sent to verify your new profile. Please fill out all required fields before submitting your information.PIVOT POINTS
Pivot Points Support (S1, S2, S3) and resistance (R1, R2, R3) lines are calculated using the high, low and closing values of the stock. The pivot and support/resistance lines are calculated using the high, low and close of the previous day. FSC - STREAMING STOCK CHARTSPLATFORM V1TC2000PREMIUM SERVICESSUPPORTSERVERMONITOR The green zone represents a profit of up to $1000. The breakeven levels are $297.18 and $273.75. The red zones show unlimited loss to the up and downside. As you slide the strike price lines on the chart and move through expiration dates, the P&L zones are updated dynamically making itDOWNLOAD SOFTWARE
TC2000 platform & data subscriptions are offered by TC2000 Software Company ("TCS"). Securities brokerage services are offered by TC2000 Brokerage, Inc. ("TCB"), a registered broker dealer, member FINRA/SIPC.TCS and TCB are separate companies affiliated throughcommon ownership.
WWW.FREESTOCKCHARTS.COM www.freestockcharts.comWELCOME
Welcome . Welcome to FreeStockCharts.com where the charts are free, the data is streaming in real-time and the features beat expensivetrading platforms.
US MARKET INDICATORS US Market Indicators. Worden’s Market Indicators, known as T2s because each symbol begins with T2, are calculated using the daily market activity of the NYSE. RSI AND WILDER'S RSI RSI and Wilder's RSI. RSI is a momentum oscillator that compares the magnitude of a stock's recent gains to the magnitude of its recent losses and turns that information into aBOLLINGER BANDS®
Bollinger Bands® Bollinger Bands were created by John A. Bollinger. They compare volatility and relative price levels over a period time. The indicator consists of three bands designed to encompass the majority of a security's price action: a Moving Average in the middle, an upper band (MA plus x -standard deviations) and a lower band (MA minus x standard deviations). VWAP AND MOVING VWAP VWAP and Moving VWAP. VWAP is a trading acronym for Volume-Weighted Average Price, the ratio of the value traded to total volume traded over a particular time horizon (usually one day).PIVOT POINTS
Pivot Points Support (S1, S2, S3) and resistance (R1, R2, R3) lines are calculated using the high, low and closing values of the stock. The pivot and support/resistance lines are calculated using the high, low and close of the previous day. WILLIAMS ACCUMULATION DISTRIBUTION Williams Accumulation Distribution. Williams AD is a running sum of positive accumulation values (buying pressure) and negative distribution values (selling pressure), as determined by price's location within a given day's true range. FSC - STREAMING STOCK CHARTSPLATFORM V1TC2000PREMIUM SERVICESSUPPORTSERVERMONITOR The green zone represents a profit of up to $1000. The breakeven levels are $297.18 and $273.75. The red zones show unlimited loss to the up and downside. As you slide the strike price lines on the chart and move through expiration dates, the P&L zones are updated dynamically making itDOWNLOAD SOFTWARE
TC2000 platform & data subscriptions are offered by TC2000 Software Company ("TCS"). Securities brokerage services are offered by TC2000 Brokerage, Inc. ("TCB"), a registered broker dealer, member FINRA/SIPC.TCS and TCB are separate companies affiliated throughcommon ownership.
WWW.FREESTOCKCHARTS.COM www.freestockcharts.comWELCOME
Welcome . Welcome to FreeStockCharts.com where the charts are free, the data is streaming in real-time and the features beat expensivetrading platforms.
US MARKET INDICATORS US Market Indicators. Worden’s Market Indicators, known as T2s because each symbol begins with T2, are calculated using the daily market activity of the NYSE. RSI AND WILDER'S RSI RSI and Wilder's RSI. RSI is a momentum oscillator that compares the magnitude of a stock's recent gains to the magnitude of its recent losses and turns that information into aBOLLINGER BANDS®
Bollinger Bands® Bollinger Bands were created by John A. Bollinger. They compare volatility and relative price levels over a period time. The indicator consists of three bands designed to encompass the majority of a security's price action: a Moving Average in the middle, an upper band (MA plus x -standard deviations) and a lower band (MA minus x standard deviations). VWAP AND MOVING VWAP VWAP and Moving VWAP. VWAP is a trading acronym for Volume-Weighted Average Price, the ratio of the value traded to total volume traded over a particular time horizon (usually one day).PIVOT POINTS
Pivot Points Support (S1, S2, S3) and resistance (R1, R2, R3) lines are calculated using the high, low and closing values of the stock. The pivot and support/resistance lines are calculated using the high, low and close of the previous day. WILLIAMS ACCUMULATION DISTRIBUTION Williams Accumulation Distribution. Williams AD is a running sum of positive accumulation values (buying pressure) and negative distribution values (selling pressure), as determined by price's location within a given day's true range. US MARKET INDICATORS US Market Indicators. Worden’s Market Indicators, known as T2s because each symbol begins with T2, are calculated using the daily market activity of the NYSE. WWW.FREESTOCKCHARTS.COM www.freestockcharts.comMOVING AVERAGE
Moving Average. Moving averages are used to smooth trends. FreeStockCharts.com offers three different types of moving averages.. Simple. A simple moving average gives equal weight to each data pointfor the period.
CANDLESTICK CHARTS
Candlestick charts. You change the price plot style to Candlesticks by clicking the Settings button at the top of the chart or by clicking Price History, then Edit.SERVERMONITOR
ServerMonitor - FreeStockCharts PLOT STYLE - FREESTOCKCHARTS Line. Plots a line connecting the closing value of each period (daily, weekly, etc.) OHLC Bar. Short for "Open, High, Low, Close", this plot style shows the open, high, lowYOUR SEARCH FOR
An email has been sent to verify your new profile. Please fill out all required fields before submitting your information.PIVOT POINTS
Pivot Points Support (S1, S2, S3) and resistance (R1, R2, R3) lines are calculated using the high, low and closing values of the stock. The pivot and support/resistance lines are calculated using the high, low and close of the previous day.ICHIMOKU CLOUD
Ichimoku Cloud. There are five plots that make up the Ichimoku Cloud indicator set. These are their names and calculations: Tenkan Sen aka “Conversion Line”: (MaxHigh+MinLow)/2 DRAWING TOOL SETTINGS Drawing Tool Settings. When you draw a trendline, Fibonacci fan or text annotation on a chart, the program remembers both they symbol you drew it on and the chart you drew it on. FSC - STREAMING STOCK CHARTSPLATFORM V1TC2000PREMIUM SERVICESSUPPORTSERVERMONITOR The green zone represents a profit of up to $1000. The breakeven levels are $297.18 and $273.75. The red zones show unlimited loss to the up and downside. As you slide the strike price lines on the chart and move through expiration dates, the P&L zones are updated dynamically making itDOWNLOAD SOFTWARE
TC2000 platform & data subscriptions are offered by TC2000 Software Company ("TCS"). Securities brokerage services are offered by TC2000 Brokerage, Inc. ("TCB"), a registered broker dealer, member FINRA/SIPC.TCS and TCB are separate companies affiliated throughcommon ownership.
WWW.FREESTOCKCHARTS.COM www.freestockcharts.comWELCOME
Welcome . Welcome to FreeStockCharts.com where the charts are free, the data is streaming in real-time and the features beat expensivetrading platforms.
US MARKET INDICATORS US Market Indicators. Worden’s Market Indicators, known as T2s because each symbol begins with T2, are calculated using the daily market activity of the NYSE.BOLLINGER BANDS®
Bollinger Bands® Bollinger Bands were created by John A. Bollinger. They compare volatility and relative price levels over a period time. The indicator consists of three bands designed to encompass the majority of a security's price action: a Moving Average in the middle, an upper band (MA plus x -standard deviations) and a lower band (MA minus x standard deviations). RSI AND WILDER'S RSI RSI and Wilder's RSI. RSI is a momentum oscillator that compares the magnitude of a stock's recent gains to the magnitude of its recent losses and turns that information into a VWAP AND MOVING VWAP VWAP and Moving VWAP. VWAP is a trading acronym for Volume-Weighted Average Price, the ratio of the value traded to total volume traded over a particular time horizon (usually one day).FREESTOCKCHARTS.COM
FreeStockCharts.com - Alerts & RemindersYOUR SEARCH FOR
An email has been sent to verify your new profile. Please fill out all required fields before submitting your information. FSC - STREAMING STOCK CHARTSPLATFORM V1TC2000PREMIUM SERVICESSUPPORTSERVERMONITOR The green zone represents a profit of up to $1000. The breakeven levels are $297.18 and $273.75. The red zones show unlimited loss to the up and downside. As you slide the strike price lines on the chart and move through expiration dates, the P&L zones are updated dynamically making itDOWNLOAD SOFTWARE
TC2000 platform & data subscriptions are offered by TC2000 Software Company ("TCS"). Securities brokerage services are offered by TC2000 Brokerage, Inc. ("TCB"), a registered broker dealer, member FINRA/SIPC.TCS and TCB are separate companies affiliated throughcommon ownership.
WWW.FREESTOCKCHARTS.COM www.freestockcharts.comWELCOME
Welcome . Welcome to FreeStockCharts.com where the charts are free, the data is streaming in real-time and the features beat expensivetrading platforms.
US MARKET INDICATORS US Market Indicators. Worden’s Market Indicators, known as T2s because each symbol begins with T2, are calculated using the daily market activity of the NYSE.BOLLINGER BANDS®
Bollinger Bands® Bollinger Bands were created by John A. Bollinger. They compare volatility and relative price levels over a period time. The indicator consists of three bands designed to encompass the majority of a security's price action: a Moving Average in the middle, an upper band (MA plus x -standard deviations) and a lower band (MA minus x standard deviations). RSI AND WILDER'S RSI RSI and Wilder's RSI. RSI is a momentum oscillator that compares the magnitude of a stock's recent gains to the magnitude of its recent losses and turns that information into a VWAP AND MOVING VWAP VWAP and Moving VWAP. VWAP is a trading acronym for Volume-Weighted Average Price, the ratio of the value traded to total volume traded over a particular time horizon (usually one day).FREESTOCKCHARTS.COM
FreeStockCharts.com - Alerts & RemindersYOUR SEARCH FOR
An email has been sent to verify your new profile. Please fill out all required fields before submitting your information. FREESTOCKCHARTS FOR MAC, MOBILE & WEB CLIENT This is the full version of FreeStockCharts powered by TC2000, the award-winning software for stock & option traders. There is no additional cost to access FreeStockCharts from aFREESTOCKCHARTS.COM
FreeStockCharts.com - Alerts & RemindersCANDLESTICK CHARTS
Candlestick charts. You change the price plot style to Candlesticks by clicking the Settings button at the top of the chart or by clicking Price History, then Edit.ALERTVIEWER
AlertViewer - freestockcharts.comFREESTOCKCHARTS
FSC Premium is no longer available. Please visit TC2000 to learn more about the latest software releases. Visit TC2000.SERVERMONITOR
ServerMonitor - FreeStockCharts DRAWING TOOL SETTINGS Drawing Tool Settings. When you draw a trendline, Fibonacci fan or text annotation on a chart, the program remembers both they symbol you drew it on and the chart you drew it on. PLOT STYLE - FREESTOCKCHARTS Line. Plots a line connecting the closing value of each period (daily, weekly, etc.) OHLC Bar. Short for "Open, High, Low, Close", this plot style shows the open, high, low WWW.FREESTOCKCHARTS.COM www.freestockcharts.comMOVING AVERAGE
Moving Average. Moving averages are used to smooth trends. FreeStockCharts.com offers three different types of moving averages.. Simple. A simple moving average gives equal weight to each data pointfor the period.
FSC - STREAMING STOCK CHARTSPLATFORM V1TC2000PREMIUM SERVICESSUPPORTSERVERMONITOR The green zone represents a profit of up to $1000. The breakeven levels are $297.18 and $273.75. The red zones show unlimited loss to the up and downside. As you slide the strike price lines on the chart and move through expiration dates, the P&L zones are updated dynamically making itDOWNLOAD SOFTWARE
TC2000 platform & data subscriptions are offered by TC2000 Software Company ("TCS"). Securities brokerage services are offered by TC2000 Brokerage, Inc. ("TCB"), a registered broker dealer, member FINRA/SIPC.TCS and TCB are separate companies affiliated throughcommon ownership.
WWW.FREESTOCKCHARTS.COM www.freestockcharts.comWELCOME
Welcome . Welcome to FreeStockCharts.com where the charts are free, the data is streaming in real-time and the features beat expensivetrading platforms.
US MARKET INDICATORS US Market Indicators. Worden’s Market Indicators, known as T2s because each symbol begins with T2, are calculated using the daily market activity of the NYSE.BOLLINGER BANDS®
Bollinger Bands® Bollinger Bands were created by John A. Bollinger. They compare volatility and relative price levels over a period time. The indicator consists of three bands designed to encompass the majority of a security's price action: a Moving Average in the middle, an upper band (MA plus x -standard deviations) and a lower band (MA minus x standard deviations). RSI AND WILDER'S RSI RSI and Wilder's RSI. RSI is a momentum oscillator that compares the magnitude of a stock's recent gains to the magnitude of its recent losses and turns that information into a VWAP AND MOVING VWAP VWAP and Moving VWAP. VWAP is a trading acronym for Volume-Weighted Average Price, the ratio of the value traded to total volume traded over a particular time horizon (usually one day).FREESTOCKCHARTS.COM
FreeStockCharts.com - Alerts & RemindersYOUR SEARCH FOR
An email has been sent to verify your new profile. Please fill out all required fields before submitting your information. FSC - STREAMING STOCK CHARTSPLATFORM V1TC2000PREMIUM SERVICESSUPPORTSERVERMONITOR The green zone represents a profit of up to $1000. The breakeven levels are $297.18 and $273.75. The red zones show unlimited loss to the up and downside. As you slide the strike price lines on the chart and move through expiration dates, the P&L zones are updated dynamically making itDOWNLOAD SOFTWARE
TC2000 platform & data subscriptions are offered by TC2000 Software Company ("TCS"). Securities brokerage services are offered by TC2000 Brokerage, Inc. ("TCB"), a registered broker dealer, member FINRA/SIPC.TCS and TCB are separate companies affiliated throughcommon ownership.
WWW.FREESTOCKCHARTS.COM www.freestockcharts.comWELCOME
Welcome . Welcome to FreeStockCharts.com where the charts are free, the data is streaming in real-time and the features beat expensivetrading platforms.
US MARKET INDICATORS US Market Indicators. Worden’s Market Indicators, known as T2s because each symbol begins with T2, are calculated using the daily market activity of the NYSE.BOLLINGER BANDS®
Bollinger Bands® Bollinger Bands were created by John A. Bollinger. They compare volatility and relative price levels over a period time. The indicator consists of three bands designed to encompass the majority of a security's price action: a Moving Average in the middle, an upper band (MA plus x -standard deviations) and a lower band (MA minus x standard deviations). RSI AND WILDER'S RSI RSI and Wilder's RSI. RSI is a momentum oscillator that compares the magnitude of a stock's recent gains to the magnitude of its recent losses and turns that information into a VWAP AND MOVING VWAP VWAP and Moving VWAP. VWAP is a trading acronym for Volume-Weighted Average Price, the ratio of the value traded to total volume traded over a particular time horizon (usually one day).FREESTOCKCHARTS.COM
FreeStockCharts.com - Alerts & RemindersYOUR SEARCH FOR
An email has been sent to verify your new profile. Please fill out all required fields before submitting your information. FREESTOCKCHARTS FOR MAC, MOBILE & WEB CLIENT This is the full version of FreeStockCharts powered by TC2000, the award-winning software for stock & option traders. There is no additional cost to access FreeStockCharts from aFREESTOCKCHARTS
FSC Premium is no longer available. Please visit TC2000 to learn more about the latest software releases. Visit TC2000. WWW.FREESTOCKCHARTS.COM www.freestockcharts.comFREESTOCKCHARTS.COM
FreeStockCharts.com - Alerts & RemindersCANDLESTICK CHARTS
Candlestick charts. You change the price plot style to Candlesticks by clicking the Settings button at the top of the chart or by clicking Price History, then Edit.SERVERMONITOR
ServerMonitor - FreeStockChartsMOVING AVERAGE
Moving Average. Moving averages are used to smooth trends. FreeStockCharts.com offers three different types of moving averages.. Simple. A simple moving average gives equal weight to each data pointfor the period.
PLOT STYLE - FREESTOCKCHARTS Line. Plots a line connecting the closing value of each period (daily, weekly, etc.) OHLC Bar. Short for "Open, High, Low, Close", this plot style shows the open, high, low DRAWING TOOL SETTINGS Drawing Tool Settings. When you draw a trendline, Fibonacci fan or text annotation on a chart, the program remembers both they symbol you drew it on and the chart you drew it on.ALERTVIEWER
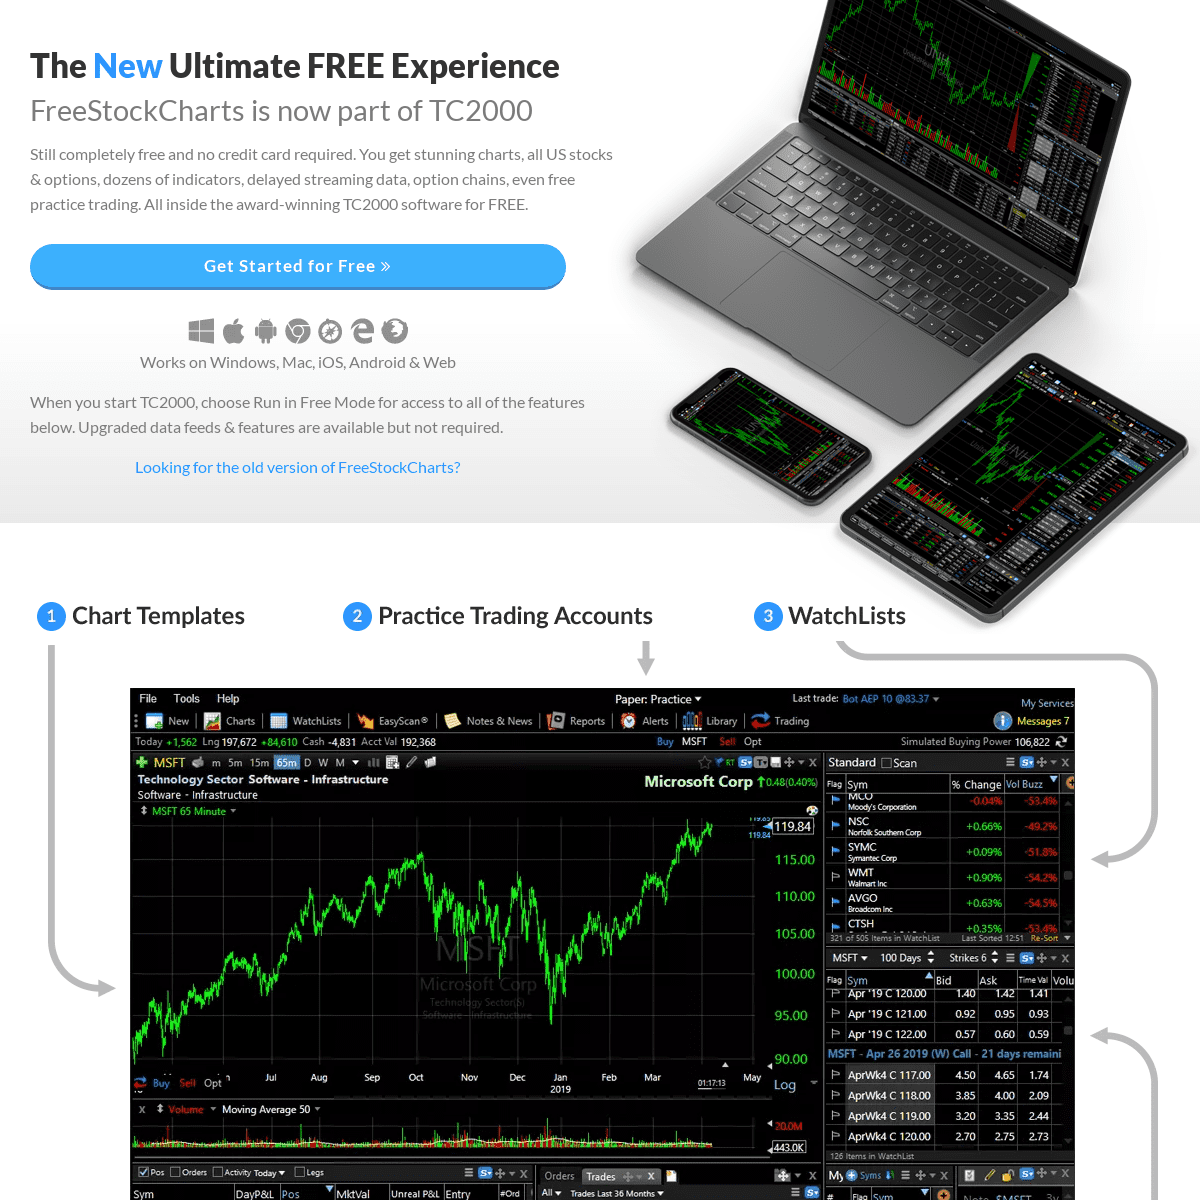
AlertViewer - freestockcharts.com THE NEW ULTIMATE FREE EXPERIENCE FREESTOCKCHARTS IS NOW PART OF TC2000 THE NEW ULTIMATE FREE EXPERIENCE FREESTOCKCHARTS IS NOW PART OF TC2000 Still completely free and no credit card required. You get stunning charts, all US stocks & options, dozens of indicators, delayed streaming data, option chains, even free practice trading. All inside the award-winning TC2000 software for FREE. Get Started for Free__ Works on Windows, Mac, iOS, Android & Web When you start TC2000, choose Run in Free Mode for access to all of the features below. Upgraded data feeds & features are available butnot required.
Looking for the old version of FreeStockCharts?Free Features
NEW OPTION CHARTS
Plot option charts with the underlying stock to see the relationship between the two. Now you can plot bid/ask data or last-trade data. This makes beautiful, streaming charts for even the most thinly traded options. Notice the shading in the stock price that shows when the option is in the money. ------------------------- FULL TRADING SIMULATOR Track your positions, pending orders and trades. This a fully functional trading simulator that gives you access to all stock & option strategies. You can practice limit orders, bracket orders with profit targets & stops, OCA's, multi-leg orders and more. This is the same trading platform used with TC2000 Brokerage , but in a free simulated mode so you can hone your skills with paper money. ------------------------- PRACTICE, PRACTICE, PRACTICE Create unlimited paper accounts to test your ideas and strategies. There's no better way to learn without risking a penny of real money. -------------------------STAY ORGANIZED
Drag-and-drop symbols to your Favorites Watchlist. Manually rearrange to keep your most important items at the top. Have a plan, stay organized and follow it. ------------------------- MARKET INDEX WATCHLISTS Access dozens of market index watchlists including the SP-500, Nasdaq 100, High Cap 1000, NYSE, Biotechs, Gold & Silver, Airlines, Oil, Financials, TSX and more. Please note that Dow Jones, sector indexes and some other indexes may require an additional subscription. -------------------------KEEP A JOURNAL
When something catches your attention or you want to remember something specific about a stock, write a note to make sure it doesn't fall through the cracks. Journaling is a great way to improve your own personal trading habits. Charts are automatically saved with your notes for quick reference when reading in the future. ------------------------- TRADE MULTI-LEG STRATEGIES FROM THE CHART This patent-pending tool makes it easy to visually understand option strategies. The P&L zones on the right side show profit, loss and breakeven levels for the stock at expiration. In this example, you want the stock to go side-ways. The green zone represents a profit of up to $1000. The breakeven levels are $297.18 and $273.75. The red zones show unlimited loss to the up and downside. As you slide the strike price lines on the chart and move through expiration dates, the P&L zones are updated dynamically making it easy to see the impact onrisk/reward.
------------------------- BUILT-IN OPTION STRATEGIES Access over 100,000 option contracts for FREE. Narrow down chains by calls, puts, number of strikes and time to expiration. Get Started for Free__Free Features
TRADE BASKETS
Multi-select symbols to batch them all into the same simulated order ticket. Then set their limit prices relative to the market. You could place an order to buy all five. Or you could use an OCA group to only get one of the five. For example, maybe you set high breakout prices and only want to buy the first stock to breakout. OCA stands forone-cancels-all.
-------------------------DRAW ON YOUR CHARTS
Draw trendlines to help you identify trends and patterns. Measure swing sizes and write notes directly on the chart that are automatically saved for the next time you return. ------------------------- PLACE LIMIT ORDERS ON THE CHART Drag limit & stop orders to visually place simulated orders atspecific prices.
-------------------------CHART LIBRARY
Customize and save charts to your own library. ------------------------- BUILT-IN OPTION CHAINS Access over 100,000 option contracts for FREE. Narrow down chains by calls, puts, number of strikes and time to expiration. ------------------------- VISUALLY SEE POSITIONS Simulated long, short and option positions are displayed on the chart for a quick reference of gains and losses. -------------------------LOTS OF INDICATORS
Plot from a large library of indicators. You can even plot indicators of indicators. _Some indicators may require a higher level ofservice._
Get Started for Free__ OPTIONAL REAL-TIME DATA FEEDS AND SERVICE LEVELS FREE mode is fully functional software that is FREE. You may optionally upgrade the service level to Silver, Gold or Platinum for additional features such as custom layouts & scanning. Real-time data feeds can be added to any premium service level. This can be done in the software or at TC2000 service plans. OPTIONAL BROKERAGE SERVICES In addition to the simulated trading, you can use TC2000 to trade stocks & options through TC2000 Brokerage, LLC, a separate company affiliated through common ownership. Please note that subscriptions to the TC2000 Software, the free layout, and data feeds are offered by Worden Brothers, Inc. All securities are offered through TC2000 Brokerage, LLC, member FINRA /SIPC . Learn more at TC2000Brokerage.com.Details
6