3
More Annotations


3


3
Favourite Annotations


1


2
Text
STATISTICAL MODELING, CAUSAL INFERENCE, AND SOCIAL SCIENCE
Skip to content
* Home
* Books
* Blogroll
* Sponsors
* Authors
* Feed
“AS A GIRL, SHE’D BEEN VERY GULLIBLE, BUT SHE HAD ALWAYS LEARNEDMORE THAT WAY.”
Posted by Andrew
on 22 March
2020, 9:56 am
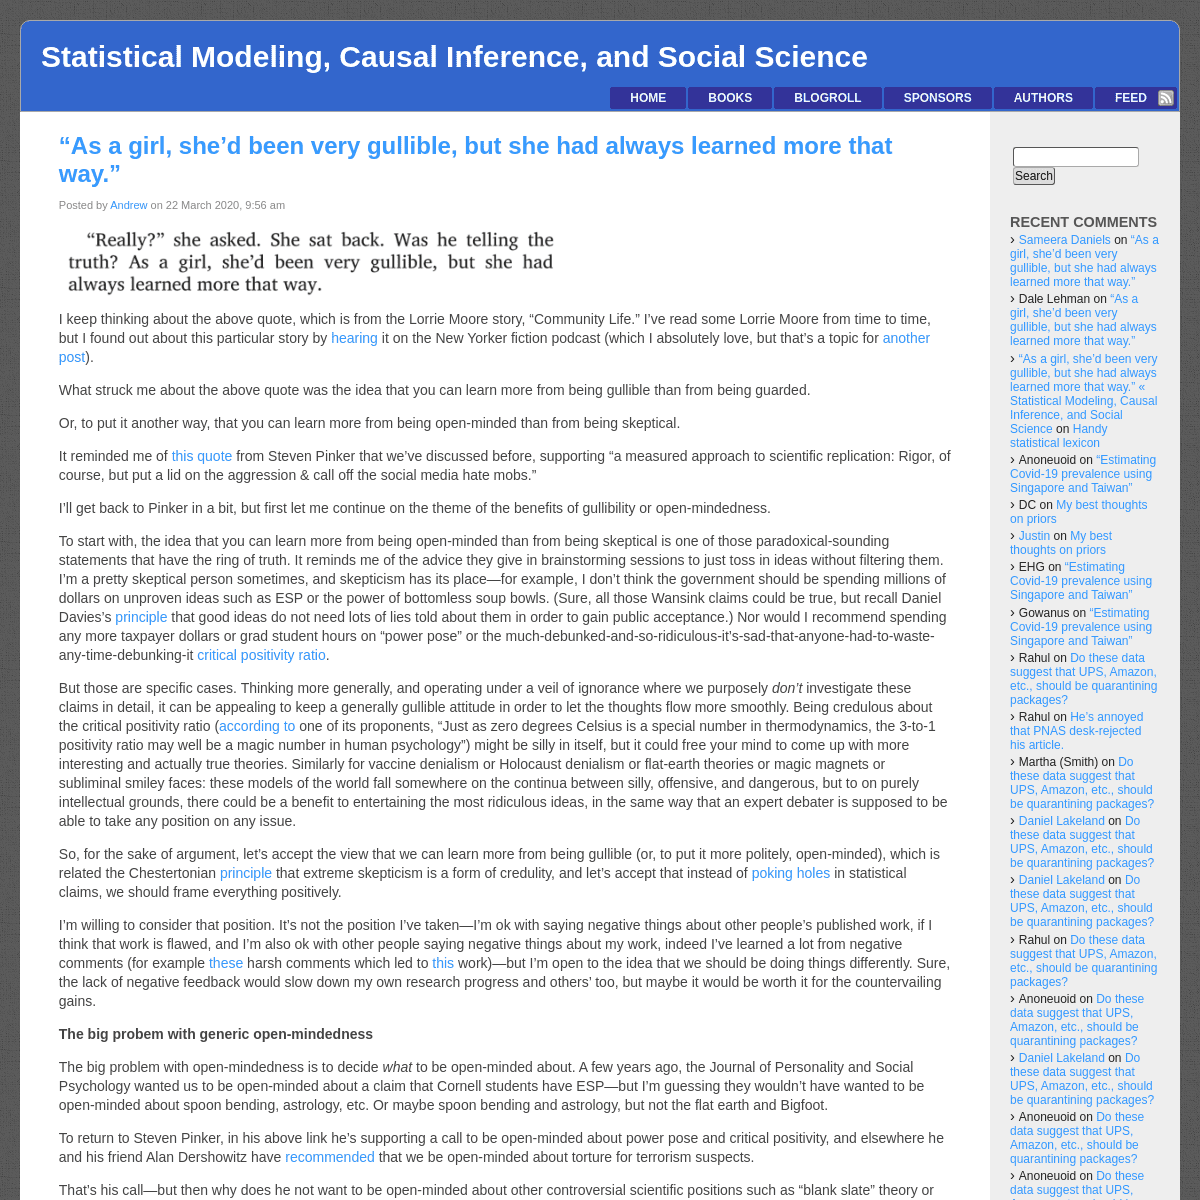
I keep thinking about the above quote, which is from the Lorrie Moore story, “Community Life.” I’ve read some Lorrie Moore from time to time, but I found out about this particular story by hearing it on the New Yorker fiction podcast (which I absolutely love, but that’s a topic for another post).
What struck me about the above quote was the idea that you can learn more from being gullible than from being guarded. Or, to put it another way, that you can learn more from being open-minded than from being skeptical. It reminded me of this quotefrom
Steven Pinker that we’ve discussed before, supporting “a measured approach to scientific replication: Rigor, of course, but put a lid on the aggression & call off the social media hate mobs.” I’ll get back to Pinker in a bit, but first let me continue on the theme of the benefits of gullibility or open-mindedness. To start with, the idea that you can learn more from being open-minded than from being skeptical is one of those paradoxical-sounding statements that have the ring of truth. It reminds me of the advice they give in brainstorming sessions to just toss in ideas without filtering them. I’m a pretty skeptical person sometimes, and skepticism has its place—for example, I don’t think the government should be spending millions of dollars on unproven ideas such as ESP or the power of bottomless soup bowls. (Sure, all those Wansink claims could be true, but recall Daniel Davies’s principle that good ideas do not need lots of lies told about them in order to gain public acceptance.) Nor would I recommend spending any more taxpayer dollars or grad student hours on “power pose” or the much-debunked-and-so-ridiculous-it’s-sad-that-anyone-had-to-waste-any-time-debunking-it critical positivity ratio.
But those are specific cases. Thinking more generally, and operating under a veil of ignorance where we purposely _don’t_ investigate these claims in detail, it can be appealing to keep a generally gullible attitude in order to let the thoughts flow more smoothly. Being credulous about the critical positivity ratio (according toone of its
proponents, “Just as zero degrees Celsius is a special number in thermodynamics, the 3-to-1 positivity ratio may well be a magic number in human psychology”) might be silly in itself, but it could free your mind to come up with more interesting and actually true theories. Similarly for vaccine denialism or Holocaust denialism or flat-earth theories or magic magnets or subliminal smiley faces: these models of the world fall somewhere on the continua between silly, offensive, and dangerous, but to on purely intellectual grounds, there could be a benefit to entertaining the most ridiculous ideas, in the same way that an expert debater is supposed to be able to take any position onany issue.
So, for the sake of argument, let’s accept the view that we can learn more from being gullible (or, to put it more politely, open-minded), which is related the Chestertonian principle that extreme skepticism is a form of credulity, and let’s accept that instead of poking holes in statistical claims, we should frame everything positively. I’m willing to consider that position. It’s not the position I’ve taken—I’m ok with saying negative things about other people’s published work, if I think that work is flawed, and I’m also ok with other people saying negative things about my work, indeed I’ve learned a lot from negative comments (for example these harsh comments which led to this work)—but I’m open to the idea that we should be doing things differently. Sure, the lack of negative feedback would slow down my own research progress and others’ too, but maybe it would be worth it for the countervailing gains. THE BIG PROBEM WITH GENERIC OPEN-MINDEDNESS The big problem with open-mindedness is to decide _what_ to be open-minded about. A few years ago, the Journal of Personality and Social Psychology wanted us to be open-minded about a claim that Cornell students have ESP—but I’m guessing they wouldn’t have wanted to be open-minded about spoon bending, astrology, etc. Or maybe spoon bending and astrology, but not the flat earth and Bigfoot. To return to Steven Pinker, in his above link he’s supporting a call to be open-minded about power pose and critical positivity, and elsewhere he and his friend Alan Dershowitz have recommended that we be open-minded about torture for terrorism suspects. That’s his call—but then why does he not want to be open-minded about other controversial scientific positions such as “blank slate” theory or creationism, or other controversial policies, such as, I dunno, torture for white-collar criminal suspectsor sex
traffickers
?
In Pinker’s memorable words: > Perhaps you can feel your blood pressure rise as you read these > questions. Perhaps you are appalled that people can so much as think > such things. Perhaps you think less of me for bringing them up. > These are dangerous ideas — ideas that are denounced not because > they are self-evidently false, nor because they advocate harmful > action, but because they are thought to corrode the prevailing moral> order.
MY POINT HERE . . .
I’m not arguing that all theories are equal. My point is that open-mindedness exists only in context: you have to decide what to beopen-minded about.
To return to the example of “brainstorming”: In a brainstorming session, we agree to share ideas without criticism—but this only goes for ideas submitted from people inside the room. Steven Pinker wants to be open to ideas submitted from “inside the room” of Harvard or of various circles of pundits—but only some sorts of pundits. Pinker’s open to the pundits who say that cops should be allowed to torture terrorism suspects, but not those who would torture embezzlers or sex traffickers. Again, at some level, that’s fine. I’ll read just about every email that’s sent to me, and I’ll respond to all sorts of blog comments—but some ideas are expressed so incoherently, or are so far out there, that I’m not going to bother with them. That’sunavoidable.
Let me also emphasize that the boundaries of acceptability, for any person, are fuzzy. There’s no way that any of us can precisely lay out exactly what ideas we’re willing to support, even without any good theory or evidence, and what ideas just tick us off. Pinker’s ok with the positivity ratio but not with blank slate; conversely, I’m fine with people studying and thinking about ideas that , but racism ticks me off. That doesn’t make me “right” and Pinker “wrong”; each of us is just willing to be open minded aboutdifferent things.
I don’t think complete open-mindedness is possible. Indeed, I’m pretty sure it’s impossible, for reasons analogous to Russell’s paradox. For example, it’s hard to simultaneously be open-minded about an attack on critics of bad statistics in science, while being open-minded about the proposition that some areas of science have become saturated by bad work, in part because of a clubby unwillingness to accept criticism of bad work. Again, I can accept that Pinker and the other defenders of open-mindedness have a legitimate position, even if I don’t agree with it. Maybe the nitpickers such as myself really are doing net harm(see also here
),
and maybe we’d be better off “sticking to sports,” as it were.
It’s possible.
My point here is only that open-mindedness is relative to what we’ve decided to be open-minded about, and who we’ve decided to let into the room. Is everything published in Psychological Science or PNAS considered to be above any harsh criticism? What about lower-tier journals? Arxiv papers? Blog posts? Work that hasn’t been endorsed by an Ivy League professor? Similarly when considering what police tactics to be open-minded about. There are not easy questions. AddThis Sharing Buttons Share to FacebookFacebookShare to TwitterTwitterShare to PrintPrintShare to EmailEmailShare to MoreAddThis1 Filed under Zombies. 2 Comments
“ESTIMATING COVID-19 PREVALENCE USING SINGAPORE AND TAIWAN”Posted by Andrew
on 21 March
2020, 10:49 pm
Jacob Steinhardt writes: > I wanted to share some applied statistical modeling that you and > your readers might enjoy. I took a break from machine learning > research for the past week to do some applied statistical modeling, > in particular trying to correct for underreporting due to > insufficient testing in some countries. My overall conclusion is > that in most European countries, backing out the number of cases > from the mortality data is reasonably reliable, but there’s other > countries where it’s less reliable and the reported deaths may > substantially underestimate the actual deaths.>
> Of course, my analysis also relies on assumptions, many of which are > obviously incorrect. But it’s a different set of incorrect > assumptions than taking the reported deaths as given, so together > these can help start to paint a clearer picture. And hopefully more > analyses and more data later will continue to improve our> understanding.
>
> The full blog post is here> ,
> and you can also find the underlying data here>
> or even rawer data on github> .
I haven’t read this in detail, but I’m forwarding in case it interests some of you. My only quick comment on the analysis is I think you should just about never use the Poisson model. Always use overdispersed Poisson. Also I recommend you fit any model in Stan, as it’s flexible so you can expand it in various ways, include new data, etc., the usual story. AddThis Sharing Buttons Share to FacebookFacebookShare to TwitterTwitterShare to PrintPrintShare to EmailEmailShare to MoreAddThis3 Filed under Public Health. 3
Comments
HE’S ANNOYED THAT PNAS DESK-REJECTED HIS ARTICLE.Posted by Andrew
on 21 March
2020, 9:29 am
Baruch Eitam writes: > This may be a rant I don’t think so and so I am sharing it with > you but one can never be sure.>
> Just had a paper desk rejected from PNAS. You may not appreciate the > journal but it is one of the most important journals a psychologist > can publish in. So if I think work out of my lab is important enough > to interest “the general scientific community” I send it there.>
> The paper in question builds on 10 years of my group’s research on > what we termed reinforcement/reward from being effective. In an > elaborate program of research (published in psychology journals), we > found, using the key measures of cognitive psychology—response > time and response frequency—that “pure effectiveness” is > rewarding (it’s more theory-laden but I think this is sufficient).>
> In the relevant study, we measured more than 100 clinically > depressed individuals and showed that their responsiveness to > effectiveness is identical to that of the general population.>
> Why is this important? Because major depression is thought to be > caused by/to involve muted responsiveness to reinforcers so our > study suggests that either this is incorrect or that multiple reward> systems exist.
>
> This is the editorial board’s evaluation which is seemingly the > basis for desk rejection (my emphasis):>
>> Editorial Board Member Comments:>>
>> Thank you for sending PNAS your paper on this important topic. >> UNFORTUNATELY, OUR GENERAL-SCIENCE AUDIENCE WOULD BE UNLIKELY TO >> FIND THIS RESEARCH PROGRAMMATIC ENOUGH TO BE FULLY CONVINCED—NOR >> DOES IT HAVE A DISTINCT INNOVATION IN OTHER WAYS (SAMPLE, >> METHODS). A SPECIALIZED JOURNAL MIGHT BE MORE RECEPTIVE.>
> So why did I think this would interest you? I find this to a > manifestation of both the confusion/crises that scientific > psychology is in and a strong example of how this biases the work > done by experimental psychologists looking for recognition.>
> Why? To buy into our interpretation of the data you need to accept > the fact that my behavioural measures index reinforcement. As I > wrote above we laboured to make this case for years. But > experimental psychologists themselves are not sufficiently sure of > this nor would a group of them agree on what would count as a > “significant (basic) discovery”.>
> This means that we (whoever we are) are F. As the gates to the > “general” journals open only by hype or curiosities. Or even > worse, by the status of the authors.>
> Note: As some of my best friends and respected colleagues published > fantastic papers in such journals I would like to stress that this > is not always the case: only that as a general rule I find it to be> correct.
>
> What do you think? My reply: Oh, PNAS is terrible! I’ve published there myself, but they publish lots of crap. But any journal is pretty random. Eitam’s paper (with Shirel Bakbani-Elkayam, Tohar Dolev-Amit, Eitan Hemed, and Sigal Zilcha-Mano) is here. I have
no view on it; you can form your own judgment on where it should be published. As noted above, publication in any particular journal is random, so I don’t think you can hold it against PNAS for rejecting this particular submission. AddThis Sharing Buttons Share to FacebookFacebookShare to TwitterTwitterShare to PrintPrintShare to EmailEmailShare to MoreAddThis4 Filed under Zombies. 8 Comments
COVID19 GLOBAL FORECASTING KAGGLEPosted by Andrew
on 20 March
2020, 6:09 pm
Someone pointed me to this, which
might be of interest to some of you. AddThis Sharing Buttons Share to FacebookFacebookShare to TwitterTwitterShare to PrintPrintShare to EmailEmailShare to MoreAddThis4 Filed under Public Health. 1
Comment
MY BEST THOUGHTS ON PRIORSPosted by Andrew
on 20 March
2020, 9:20 am
My best thoughts on priors (also the thoughts of some other contributors) are at the Prior Choice Recommendations wiki.
And this more theoretical paper should be helpful too. I sent these links in response to a question from Zach Branson about priors for Gaussian processes. Jim Savage also pointed to our paperon
simulation-based calibration of Bayesian models. I don’t have so much experience with GP’s, but I agreed that you have to be careful about the nonidentifiable region, as I became aware when doing this mini-project which I never wrote up except on the blog. The
discussion thread at that link is interesting. AddThis Sharing Buttons Share to FacebookFacebookShare to TwitterTwitterShare to PrintPrintShare to EmailEmailShare to MoreAddThis10 Filed under Bayesian Statistics.
15 Comments
WE NEED TO PRACTICE OUR BEST SCIENCE HYGIENE. Posted by Keith O’Rourkeon 19 March
2020, 1:08 pm
Of course I am not referring to hand-washing and social distancing but rather heightened social interactions between those now engaged or who can get engaged in trying to get less wrong about Covid19. That is, being open about one’s intentions (the purpose of the effort), one’s methods and one’s data and data sources. For instance these data sources, Canada testing and results , US testing and results and some information on ongoing trials(which
underlines the need to for good expertise and advice.) I know, conjectures and opinions can be help, but I would suggest comments here be limited to data sources and methods to analyse data sources and of course trial designs. p.s. We each need to find where our particular mix of skills will be most useful and join in there if and when we can. I am currently on standby where I work, so I won’t know exactly what I will be working on. In light of this, I am trying to get a scan of were good clinical research/evaluation material and advice might be located. This post is by Keith O’Rourke and as with all posts and comments on this blog, is just a deliberation on dealing with uncertainties in scientific inquiry and should not to be attributed to any entity otherthan the author.
AddThis Sharing Buttons Share to FacebookFacebookShare to TwitterTwitterShare to PrintPrintShare to EmailEmailShare to MoreAddThis4 AddThis Sharing Buttons Share to FacebookFacebookShare to TwitterTwitterShare to PrintPrintShare to EmailEmailShare to MoreAddThis5 Filed under Miscellaneous Statistics,
Public Health
. 21
Comments
THE NEW YORKER FICTION PODCAST: HOW IT’S GREAT AND HOW IT COULD BEIMPROVED
Posted by Andrew
on 19 March
2020, 9:23 am
I was having some difficulty with radio reception on my bike a few years ago so I switched to prerecorded music and podcasts. This American Life is the best, but if I’m going a lot of places I can exhaust the supply of recent episodes. For awhile I was listening to Wait Wait which is just fine (the live show is fun too) but after awhile became too much same old same old. Recently I’ve been listening to the New Yorker fiction podcast, which is just great. The New Yorker fiction podcasts have a pattern. A current New Yorker fiction writer reads a story published in the New Yorker that was written by someone else. Sometimes the story is decades old, sometimes it’s recent. The episode starts with the New Yorker fiction editor discussing the story with the guest, then the guest reads the story aloud, then there’s more discussion of the story. I like about a third of the stories, so what I’ll do is start listening to an episode, then I might listen to it all the way through, or I might skip it and go to the next one, if the initial interview or the story itself is just too boring. (Just my take; I recognize that a story that I find boring, others might love.) The stories with cute fabulism, or the ones that take place in 1950s rural Ireland, those I usually skip. But one in three isn’t bad. Sometimes the stories are old favorites like The Lottery—which I’d read many years ago, but only when hearing it aloud did I realize how much it was about sexism—other times they’re new discoveries for me. Also, some guests are particularly fun to listen to. The discussions are often really interesting. Lots of back-and-forth, and the editor/interviewer, Deborah Treisman, has good thoughts and also keeps the conversation moving along. I like how the conversations go on two levels: the craft of the writer and the world of the story. There are lots of discussions along the lines of, Why did character X do action Y? What is going to happen next? How would character Z react under certain circumstances? And so forth. The only way I think these conversations could be improved would for them to be occasionally critical. I’ve listened to dozens of these episodes, and they’ve all been relentlessly positive. Guest after guest says how they love the story, how the author is so brilliant, etc etc etc. Never a critical word. Celebration is fine. But writers, even celebrated New Yorker writers, are just people. Their stories are not perfect. Or, even if the stories _are_ perfect, they can still be poked. For example, the most recent episode I listened to was Roddy Doyle reading Lorrie Moore.
I liked it. I’m a Lorrie Moore fan, and I’d never heard Doyle speak: he had a great accent and was really thoughtful, an excellent choice to read and discuss a story. Moore’s story, Community Life, was thought-provoking and funny, and it featured an appealing female character who was a bit of a victim and had to deal with an unappealing man. This happens a lot in Moore’s stories, and I would’ve liked to to hear Doyle and Treisman discuss this: Not just how great Moore is, but did she really have to make this character, too, a passive victim? Did she always have to do it this way? Does Moore weaken the story by stacking the deck, as it were, by making her female character impeccably moral and her male character a bitrepulsive?
Similarly, I’d be interested in hearing the same discussion, in reverse, when they discuss a John Updike story. Updike presents the male perspective, where the man is always the hero. Even when the male character behaves badly, you’re still seeing things from his perspective, and, arguably, the female characters aren’t fully real. With Moore it’s the reverse: it’s always a sane, funny, sensitive woman having to deal with the brutish men in her life. That’s fine—it’s her perspective, and if Updike can have a successful career with his view of the world, Moore’s entitled to hers too. You might as well criticize Philip Roth for writing about Jews from Newark, or criticize Philip K. Dick for never writing a book without a strong measure of paranoia. I want to hear a more critical discussion because I think it would be more interesting, to not just say what the story did right but to also consider how it might’ve been different, and even better, in some way. The point is not that Moore, or Updike, or whoever, should’ve written it differently, it’s just to explore possibilities. Some of this exploration is limited by the restriction to only say positivethings.
In any case, I’ll keep listening. P.S. In the never-gonna-happen world in which I get to go on this podcast and pick my favorite New Yorker fiction story, I’d pick something by Malcolm Gladwell. Not really. That was just a joke. Actually, my favorite New Yorker story is Adam Gopnik’s The MusicalHusbands.
AddThis Sharing Buttons Share to FacebookFacebookShare to TwitterTwitterShare to PrintPrintShare to EmailEmailShare to MoreAddThis3 Filed under Literature. 19
Comments
ANOTHER BAYESIAN MODEL OF CORONAVIRUS PROGRESSIONPosted by Andrew
on 18 March
2020, 9:20 pm
Jon Zelner writes:
> Just ran across this paper>
> which I think is worth signal-boosting.>
> I also think that the model in here could potentially be > implemented in Stan (though it might require some work on > marginalizing the branching process model) and could be quite useful > if it could be made more hierarchical. The point here is not that these particular estimates are correct—as always, inferences are only as good as the data they’re based on—but that the model in this paper could be useful more generally.See here
,
here
,
here
,
and here
for further discussion of coronavirus models. AddThis Sharing Buttons Share to FacebookFacebookShare to TwitterTwitterShare to PrintPrintShare to EmailEmailShare to MoreAddThis4 Filed under Bayesian Statistics,
Public Health
, Stan
. Comment
HILDA BASTIAN AND JOHN IOANNIDIS ON CORONAVIRUS DECISION MAKING; JON ZELNER ON VIRUS PROGRESSION MODELSPosted by Andrew
on 18 March
2020, 9:53 am
1. Hilda Bastian writes:
> Doing nothing for which there is no strong evidence is doing > something: it’s withholding public health interventions that, on > the balance of what we know, could save a lot of lives and trauma > – including the lives of a lot of healthcare workers. > Secondly, the need for societies to be able to monitor the impact is > an argument for putting more effort into monitoring. Weaknesses in > that is not a reason to not act. . . .>
> We do not know “the” case fatality rate, but that won’t be the > same everywhere, dependent as it is on regional differences like > health system capacity and levels of antibiotic resistance for > secondary pneumonia. And while it means best and worst case > scenarios are far apart, that does not of itself give best case > scenarios greater weight. . . .>
> Could there be fiascos from over-reaction? Yes, there could, but > several countries have introduced measures that are draconian, > appear to have pegged outbreaks back, and are loosening the > measures. Could there be fiascos from under-reaction? Well, we > already have some of those. . . . there is broad consensus that this > is a public health emergency, and we have to take action, not just > sit there studying the situation and waiting for better information > before acting. I think the stakes are too high to ignore the public > health community urging us to act in favor of a “hot take” from > someone who doesn’t seem to have done his homework. She was clarifying some issues raised by this post from John Ioannidis, who wrote: > At a time when everyone needs better information, from disease > modelers and governments to people quarantined or just social > distancing, we lack reliable evidence on how many people have been > infected with SARS-CoV-2 or who continue to become infected. Better > information is needed to guide decisions and actions of monumental > significance and to monitor their impact. . . . Three months after > the outbreak emerged, most countries, including the U.S., lack the > ability to test a large number of people and no countries have > reliable data on the prevalence of the virus in a representative > random sample of the general population. . . . When reading this article I automatically translated “representative random sample” to “representative sample” (where the representativeness could be be achieved using poststratification). There are lots of ways to get a representative sample. 2. I’ve been talking a bit with Jon Zelner about coronavirus progression models. Zelner writes: > I think in some ways that the whole transmission modeling approach, > when done well, shares a lot of DNA w/MRP . Like this paper> ,
> Substantial undocumented infection facilitates the rapid > dissemination of novel coronavirus (SARS-CoV2), by Ruiyun Li, Sen > Pei, Bin Chen, Yimeng Song, Tao Zhang, Wan Yang, and Jeff Shaman > that just came out—one of the times where I think we can say the > material is indeed tabloid-worthy—directly models both the > transmission process and the observation process that together give > rise to hard-to-interpret patterns of who is observed testing > positive for coronavirus.>
> One of the things that makes these nonlinear/diff-eq models kind of > interesting in this way is also that sometimes you can’t explain > the geometry of the epidemic curve with just the observed data, i.e. > the peak is too high to be explained by just the small fraction of > observed cases. So modeling the dynamic process actually informs the > estimates of the age-specific reporting rates, etc. You know that saying, There’s nothing so practical as a good theory? That’s what’s going on here. Latent-variable models are necessary both to understand the process and to make predictions aboutobservables.
See here
,
here
,
and here
for more on these models. AddThis Sharing Buttons Share to FacebookFacebookShare to TwitterTwitterShare to PrintPrintShare to EmailEmailShare to MoreAddThis6 Filed under Bayesian Statistics,
Miscellaneous Statistics,
Public Health
. 106
Comments
JUST SOME NUMBERS FROM CANADA Posted by Keith O’Rourkeon 18 March
2020, 7:55 am
One of my colleagues posted this link yesterday to a shiny app giving Covid19 testing and results for all provinces in Canada. Seems to match all other sources I have heard from. About 43,000 tests and 600 positive. The cumulative graphs of cases by province indicates Alberta is currently having the fastest increases. Hopefully the numbers will get on a github at some point. Anything similar in the US yet, giving total and by state testing andresults?
This post is by Keith O’Rourke and as with all posts and comments on this blog, is just a deliberation on dealing with uncertainties in scientific inquiry and should not to be attributed to any entity otherthan the author.
AddThis Sharing Buttons Share to FacebookFacebookShare to TwitterTwitterShare to PrintPrintShare to EmailEmailShare to MoreAddThis4 Filed under Public Health. 34
Comments
ESTIMATES OF THE SEVERITY OF COVID-19 DISEASE: ANOTHER BAYESIAN MODEL WITH POSTSTRATIFICATIONPosted by Andrew
on 17 March
2020, 8:57 pm
Following up on our discussions hereand here
of poststratified models of coronavirus risk, Jon Zelner writes: > Here’s a paper > that I think shows what could be done with an> MRP approach.
From the abstract:
> We used individual-case data from mainland China and cases detected > outside mainland China to estimate the time between onset of > symptoms and outcome (death or discharge from hospital). We next > obtained age-stratified estimates of the CFR by relating the > aggregate distribution of cases by dates of onset to the observed > cumulative deaths in China, assuming a constant attack rate by age > and adjusting for the demography of the population, and age- and > location-based under-ascertainment. We additionally estimated the > CFR from individual line-list data on 1,334 cases identified outside > mainland China. We used data on the PCR prevalence in international > residents repatriated from China at the end of January 2020 to > obtain age-stratified estimates of the infection fatality ratio > (IFR). Using data on age-stratified severity in a subset of 3,665 > cases from China, we estimated the proportion of infections that > will likely require hospitalisation. And here’s what they found: > We estimate the mean duration from onset-of-symptoms to death to be > 18 days and from onset-of-symptoms to hospital discharge to be 23 > days. We estimate a crude CFR of 3.7% in cases from mainland China. > Adjusting for demography and under-ascertainment of milder cases in > Wuhan relative to the rest of China, we obtain a best estimate of > the CFR in China of 1.4%) with substantially higher values in older > ages. Our estimate of the CFR from international cases stratified by > age (under 60 / 60 and above) are consistent with these estimates > from China. We obtain an overall IFR estimate for China of 0.7%, > again with an increasing profile with age. I edited the above paragraph by rounding all numbers and removing the 95% intervals. The intervals are model-based and look way too narrow compared to actual uncertainty. For example, their estimate of the mean duration from onset to death is 17.8 days with a 95% interval of 16.9–19.2 days. There’s no way they can know this so precisely. And their estimate of the crude CFR from mainland China is 3.67% with 95% interval of 3.56%-3.80%. Again, this interval is too narrow to tell us anything. With an interval so narrow, we might as well just take the point estimate. I’ve not looked at the substance of their data or model but I did notice they used Bayesian inference, which I think is a good idea given the need to integrate different data sources when studying this problem. I’m pretty sure they could fit their model in Stan, which would be a good idea as it would allow them to incorporate more structure in the model without requiring onerous programming effort to fit it. Also I skimmed through the paper and have some issues with their prior distributions (compare to general principles here).
But that’s fine, there’s room for improvement. This and other models will need to be re-fit with new data in any case. There’s some literature on this problem. For example, Verity et al.cite a 2005 article
by A. C. Ghani
et al., “Methods for Estimating the Case Fatality Ratio for a Novel, Emerging Infectious Disease,” in the American Journal of Epidemiology. That earlier work is non-Bayesian, though, which will create challenges if you’re dealing with sparse data or trying to combine multiple sources of information.P.S. More her
e.
AddThis Sharing Buttons Share to FacebookFacebookShare to TwitterTwitterShare to PrintPrintShare to EmailEmailShare to MoreAddThis5 Filed under Bayesian Statistics,
Public Health
,
Statistical computing.
10 Comments
DO THESE DATA SUGGEST THAT UPS, AMAZON, ETC., SHOULD BE QUARANTININGPACKAGES?
Posted by Andrew
on 17 March
2020, 5:44 pm
Doug Davidson writes: > I just wanted to draw your attention to this paper>
> that used Stan.>
> They are concerned with how long the virus remains viable on > different surfaces, including packaging material. I think this will > become more important as time goes on, as people rely (even) more on > delivery than they do now.>
> I guess one question is whether these estimates are credible. If > they are, delivery services (Amazon, UPS, etc.) could change policy > so that packages are routinely quarantined for a period > corresponding to the upper bound of the estimates. I don’t know > enough about decision theory, or all of the factors involved to even > pose this question in cost-benefit terms, but maybe some of your> commenters do!
The above-linked article states that “the virus can remain viable and infectious in aerosols for multiple hours and on surfaces up todays.”
I’ve not tried to evaluate this work but I’m sharing it here. There are two questions here: first, the relevance of these data to real-world disease transmission; second, the propagation of these estimates from virus counts to exposure probabilities to effects on the transmission network, to get a sense of the potential benefits of quarantining packages. Or maybe they could just wipe everything down?I dunno.
AddThis Sharing Buttons Share to FacebookFacebookShare to TwitterTwitterShare to PrintPrintShare to EmailEmailShare to MoreAddThis13 Filed under Decision Theory,
Public Health
. 56
Comments
PRIOR PREDICTIVE, POSTERIOR PREDICTIVE, AND CROSS-VALIDATION ASGRAPHICAL MODELS
Posted by Bob Carpenteron 17
March 2020, 3:00 pm
I just wrote up a bunch of chapters for the Stan user’s guide on prior predictive checks, posterior predictive checks, cross-validation, decision analysis, poststratification (with the obligatory multilevel regression up front), and even bootstrap (which has a surprisingly elegant formulation in Stan now that we have RNGs in trnasformed data). Andrew then urged me to look at figure 1 of Gelman, Meng, and Stern’s 1996 paper on posterior predictive assessement (I would’ve included a diagram if the journal didn’t own the copyright). I looked at figure 1 and got really confused about why the y and y_rep were on the same side of theta. Then Andrew said it was like a probabilistic program. Which I took to mean you could write in BUGS directed graphical modeling language. Below, I write down how I’d code prior and posterior predictive checks and cross-validation in a graphical modeling language. Instead of arrows and boesLet me present all this in a unified way the way I think it’s clearest, which does away with arrows and boxes and just uses graphical modeling notation (like BUGS or Stan supports). Then Andrew can fill all of us in on what I’m missing A SIMPLE REGRESSION EXAMPLE Nothing interesting here, just a simple regression of a univariate outcome given a univariate predict. I’ll use explicit indexing to make it clear where there are multivariate quantities. I’m also just throwing down an arbitrary prior for completeness.a ~ normal(0, 2)
b ~ normal(0, 2)
s ~ lognormal(0, 1) y ~ normal(a + b * x, s) The variables a, b, and s are parameters, whereas y and x are the observed outcomes and predictors. y and x will be known, and we’ll run something like Stan to get posterior draws a, b, s ~ p(a, b, s | x, y) POSTERIOR PREDICTIVE CHECKS To get posterior predictive draws, we add a single line to thegraphical model,
a ~ normal(0, 2)
b ~ normal(0, 2)
s ~ lognormal(0, 1) y ~ normal(a + b * x, s) y_rep ~ normal(a + b * x, s) Here y_rep is declared as a parameter in Stan, because it’s not observed. Also note that the same x values are used for both y andy_rep.
We observe y and x as before, but now get posterior draws for y_rep in addition to the regression parameters, a, b, s, y_rep ~ p(a, b, s, y_rep | x, y) We just throw away the draws for the parameters and get draws from the posterior predictive distribution y_rep ~ p(y_rep | x, y) Monte Carlo methods are so much easier than calculus. PRIOR PREDICTIVE CHECKS This one just drops the line with the data, but continues to use the same predictor vector x for the replications. The graphical model isa ~ normal(0, 2)
b ~ normal(0, 2)
s ~ lognormal(0, 1) y_rep ~ normal(a + b * x, s) Our posterior draws in a system like Stan now look like a, b, s, y_rep ~ p(a, b, s, y_rep | x) and we throw away the parameters again to get prior predictive draws, y_rep ~ p(y_rep | x) HELD-OUT EVALUATION AND CROSS-VALIDATION Suppose we divide our N data items up into a training set of size M and test set of size N – M. We’ll train on the training set then predict for the test set.a ~ normal(0, 2)
b ~ normal(0, 2)
s ~ lognormal(0, 1) y ~ normal(a + b * x, s) y ~ normal(a + b * x, s) We’ll provide y and x as data (that is, the training set of y and all of x). Then we get draws from the posterior predictivedistribution:
a, b, s, y ~ p(a, b, s, y | x, y) and we again just drop the parameters to get posterior predictive draws for evaluation y ~ p(y | x, y) For cross-validation, you just provide different slices. Or random slices. I show how to do that in the forthcoming user’s guide chapters. I also show how to use the generated quantities block to make the predictive draws pure Monte Carlo draws and also cut down on computation time compared to using MCMC. But that’s just an implementation efficiency detail. WHAT ABOUT GELMAN, MENG, AND STERN’S DIAGRAM? I’m still confused. But now my confusion is more about why there are multiple y_rep. I only use one in my approach. Then we get simulations for it which characterize the relevant predictive distribution. Also, I don’t understand why there’s only one theta in the posterior predictive diagram (1a), whereas there are multiples in the prior predictive diagram. To me, the only difference is that the edge for y doesn’t show up in the prior predictive check. It’s something you have, but not something that’s in the model. I think what Gelman, Meng, and Stern are doing here is trying to include y in the prior predictive model. My guess is that Andrew’s going to say that they know y at the point the prior predictive check is performed and all data should be on the table. Unfortunately, that requires what’s essentially a BUGS-style cut in the graphical model where you don’t let information from y bleed into theta. The multiple theta is an attempt to render it without cut. At least that’s my guess. Let’s see what Andrew says. (I could just ask via email, but it’s more fun to do my homework in front of a live audience.) AddThis Sharing Buttons Share to FacebookFacebookShare to TwitterTwitterShare to PrintPrintShare to EmailEmailShare to MoreAddThis4 Filed under Bayesian Statistics,
Stan ,
Statistical computing.
2 Comments
“A PATH FORWARD FOR STAN,” FROM SEAN TALTS, FORMER DIRECTOR OF STAN’S TECHNICAL WORKING GROUPPosted by Andrew
on 17 March
2020, 9:08 am
Sean Talts was talking about his ideas of how Stan should move forward, given anticipated developments in the probabilistic programming infrastructure. I encouraged his to write up his ideas in some sort of manifesto form, and he did so. Here it is. The title is “A Path Forward for Stan,” and it begins: > Stan has proven success as a statistical modeling language for tens > of thousands of scientists across the globe. Since its design in > 2011, the landscape of statistical computing has shifted such that > there are now new opportunities for Stan to achieve better > performance and encourage new user-developers. There are a few paths > forward, but I’ll describe just one particularly enticing one that > would take some major investment over the next few years. There are > a few areas that need improvement, but the keystone of this vision I > call “Stan in Stan” – extending Stan to support writing most > of the Math library in the Stan language itself. . . .>
> In order for Stan to stay relevant, we need to introduce several > major technical changes and adapt some of the revelations from > surrounding fields in order to adapt.>
> Stan has been so successful in large part because of the huge amount > of effort that has gone into the pedagogy, methodology research, > broader ecosystem packages like those for visualization, and most > importantly its amazingly supportive community. But here I will be > focusing on a fairly high-level architectural view of the software > artifacts and end-user experience around using the core tools, just > because that’s more in my wheelhouse.>
> My framework for thinking about this design space is pluralistic, > with two separate goals that are difficult to unify. The first could > be summarized as a shift towards optimizing the time-to-first-sample > of a new user. . . . Separately, I believe we should think more > explicitly about a specific aspect of sustainability: what can we do > to entice more of Stan’s users into contributing back to Stan. . .> .
It’s hard for me to evaluate Sean’s particular suggestions regarding the language etc., but in any case this sort of insider’s perspective might be of interest to many of you. P.S. Thanks to Zad for the above image of a cat with a fairly high-level view of the end-user experience. AddThis Sharing Buttons Share to FacebookFacebookShare to TwitterTwitterShare to PrintPrintShare to EmailEmailShare to MoreAddThis2Filed under Stan
, Statistical
computing
.
3 Comments
BREAKING THE FEEDBACK LOOP: WHEN PEOPLE DON’T CORRECT THEIR ERRORSPosted by Andrew
on 16 March
2020, 9:51 am
OK, so here’s the pattern:
1. Someone makes a public statement with an error, an error that advances some political or personal agenda. 2. Some other people point out the error. 3. The original author refuses to apologize, or correct the error, or thank people for pointing out the error, and sometimes they don’t even acknowledge the correction in any way. It’s happened in Perspectives on Psychological Science,
it’s happened in the American Journal of Hypertension,
it’s happened in the New York Times(of course
),
and, hey! Politicians do it too! German Lopez reports:
> Democratic presidential candidates Elizabeth Warren and Kamala > Harris marked the five-year anniversary of the Ferguson, Missouri, > police shooting of Michael Brown last week with tweets claiming that > the cop who shot Brown “murdered” the 18-year-old black man.>
> But the evidence, including a report released by President Barack > Obama’s Department of Justice, says otherwise. . . . Between now and the time this post appears, Warren or Harris might issue corrections and apologies. But I doubt it. After all, Al Sharpton never apologized for attacking that prosecutor, Donald Trump never apologized for the things he said about 9/11, etc. My point here is not “false equivalence,” just that it’s considered standard operating procedure for people to not correct their errors, even when they’re making false statements about clearly-identified people, events, or statistics. The original statement could be an honest mistake, a reasonable misunderstanding, an opportunistic bit of exaggeration, a flat-out lie, or something in between . . . whatever. The point is that the statement is clearly wrong, the evidence is right there in front of these people, but they still won’t admit theerror.
It’s a sad day when political figures on both sides of the aisle are behaving as badly as Ivy League professors and New York Times columnists. What’s the world coming to? All jokes aside, I think this is a big deal. The self-correcting nature of science, or of politics, is a lot harder to occur when powerful figures in the system refuse to self-correct. It also provides a bad example for others and promotes an our-team-versus-their-team attitude. I understand that this is going to happen—it’s human nature to lie—or, if not to lie, than to accept questionable claims that agree with our predisposed notions—and then to not admit the error. But at least we should call people out on it, also we should be suspicious of other claims made by people who are so comfortable with being associated with untruths. AddThis Sharing Buttons Share to FacebookFacebookShare to TwitterTwitterShare to PrintPrintShare to EmailEmailShare to MoreAddThis3 Filed under Political Science,
Sociology
, Zombies
. 36
Comments
“OLDER AMERICANS ARE MORE WORRIED ABOUT CORONAVIRUS — UNLESS THEY’RE REPUBLICAN”Posted by Andrew
on 15 March
2020, 5:59 pm
Philip Greengard points us to the above-titled news articleby Philip Bump.
The article was just fine, a reminder of modern-day political polarization. The only thing that bothered me were the graphs. I redrew them above. Here were the original versions: I see a few problems with these graphs. First, the information is duplicated because the percentages all add up to 99% or 100%. Second, the patterns are super hard to follow because your eye jumps up and down between the yes and no percentages. Third, the x-axis is multiplexed so it’s hard to compare age groups within parties. Fourth, nothing is really done with the color scheme. I think my redrawn version (it took me about a half hour in R; I guess Hadley could’ve done it better in 5 minutes) fixes these problems. I put age on the x-axis because it seems natural to go from young to old. Once I did this, I thought it would be good to get some more discrimination on the age scale. An earlier graph in that news article showed age groups of 18-35, 35-49, 50-64, and 65+, so I clickedthrough
to the survey report from Quinnipiac poll. But that left me even more baffled because I didn’t see the party x age breakdown in the report at all. Maybe I didn’t know where to look. P.S. I’m kinda embarrassed to share my R code cos it’s so ugly, but in the interest of openness, here it is: Continue reading ‘“Older Americans are more worried about coronavirus — unless they’re Republican”’ » AddThis Sharing Buttons Share to FacebookFacebookShare to TwitterTwitterShare to PrintPrintShare to EmailEmailShare to MoreAddThis2K Filed under Political Science,
Statistical graphics.
35 Comments
“ARE RELATIONAL INFERENCES FROM CROWDSOURCED AND OPT-IN SAMPLES GENERALIZABLE? COMPARING CRIMINAL JUSTICE ATTITUDES IN THE GSS AND FIVE ONLINE SAMPLES”Posted by Andrew
on 15 March
2020, 9:30 am
Justin Pickett writes: > You’ve blogged a good bit on MTurk, weighting, and model-based > inference. Drawing heavily on your work (Gelman, 2007; Gelman and > Carlin, 2002; Wang et al., 2015), Andrew Thompson and I > just published a study> that
> largely confirms your concerns about MTurk (and opt-in samples), but > that also emphasizes the promise of model-based adjustments. The > article focuses on bias in regression coefficients that results when > selection is a collider variable. It attempts to pull together > insights from Gelman (2007), Solon et al. (2015), Winship and > Radbill (1994), put them together in one place, and apply them to > online sampling. Coincidentally, a couple days earlier Paul Alper sent an email pointing us to this news article by Andy Newman about participants in Mechanical Turk. AddThis Sharing Buttons Share to FacebookFacebookShare to TwitterTwitterShare to PrintPrintShare to EmailEmailShare to MoreAddThis5 Filed under Multilevel Modeling,
Sociology
. Comment
THE ROAD BACK
Posted by Andrew
on 14 March
2020, 9:34 am
Paul Kedrosky points us to this news article by Liam Mannix, “Cold water poured on scientific studies based on ‘statistical cult.'” Here’s what I wrote about this when it came up last year:
> The whole thing seems pretty pointless to me. I agree with Kristin > Sainani that the paper on MBI does not make sense. But I also > disagree with all the people involved in this debate in that I > don’t think that “type 1 error rate” has any relevance to > sports science, or to science more generally. See for example here>
> and here
> .
>
> I think scientists should be spending more time collecting good data > and reporting their raw results for all to see, and less time trying > to come up with methods for extracting a spurious certainty out of > noisy data. I think this whole type 1, type 2 error thing is a > horrible waste of time which is distracting researchers from the > much more important problem of getting high quality measurements. AddThis Sharing Buttons Share to FacebookFacebookShare to TwitterTwitterShare to PrintPrintShare to EmailEmailShare to MoreAddThis5Filed under Sports
, Zombies
. 11
Comments
SPONSOR A STAN POSTDOC OR PROGRAMMER!Posted by Andrew
on 13 March
2020, 9:41 am
There’s lots of great stuff going on with Stan and related research on Bayesian workflow and computation. One way that we can do more for the community is by hosting postdocs and programmers. And one way this can happen is from corporate support. The idea is that the postdoc or programmer is working on projects that support your company’s goals directly while also developing open-source research that will serve the entire community, indeed, not just Stan users, as many developments from our research group have become more broadly useful within applied statistics and have been incorporated into other software as well. Ideally, this will be a way for you to work toward your internal goals while also contributing to the open-source community. Beyond any direct benefits on your own projects, you should also gain by being first to learn about whatever new ideas are being developed by your sponsored postdoc or programmer, and also by having some input intowhat we work on.
We’ve done this before. The mechanism is that your company pays Columbia University to support the researcher. Or you could hire someone directly to work internally on Stan R&D, but in practice it has often been simpler to do things through Columbia, which can have low overhead and minimal bureaucracy. Please get in touch with us directly if you’re interested inpursuing this.
AddThis Sharing Buttons Share to FacebookFacebookShare to TwitterTwitterShare to PrintPrintShare to EmailEmailShare to MoreAddThis2Filed under Stan
. 1 Comment
100 THINGS TO KNOW, FROM LANE KENWORTHYPosted by Andrew
on 12 March
2020, 9:29 am
The sociologist has this great post:
> Here are a hundred things worth knowing about our world and about > the United States. Because a picture is worth quite a few words and > providing information in graphical form reduces misperceptions, I > present each of them via a chart, with some accompanying> text.
This is great stuff. The only thing I don’t like is that many of his graphs have a lower limit of zero, but he plots the y-axis to go below zero. This makes it harder for me to see the scale of the changes. Here’s an example: The graph is clean and well labeled; I’d just rather have the y-axis start at 0 than start negative (also the labels at 11, 22, 33 are distracting; why not 10, 20, 30?). I also like how he gives the source of the data. Next step would be to link to the data themselves and the code used to make the graph. That would be a Markdown file, I guess. Also, I’d prefer some of the graphs on the log scale; not the above graphs so much, but for graphs with larger dynamic ranges like thisone:
I can see how Kenworthy would decide to stay on the original scale, as the log scale will confuse many non-technically-trained readers. But why not have both? Or maybe two different webpages, one with all the graphs on the original scale and one on the log scale whereappropriate?
This would be a good student project, to turn Kenworthy’s page into a Markdown file and produce two versions of (most of) the graphs. Also, the label on this graph is (unintentionally) funny: At the bottom it says: “‘Asl’ is Australia; ‘Aus’ is Austria.” But why not just spell out the country names on the graph itself? There’s plenty of room! And here are Kenworthy’s 100 items: > 1. Economic growth | 2. Government social programs | 3. Democracy | > 4. Affluence and universalistic humanism | 5. Affluence and personal > freedom | 6. Extreme poverty | 7. Incomes of the poor | 8. Equality > of opportunity | 9. Education and earnings | 10. College completion > | 11. Parents’ income and college completion | 12. Employment > among women | 13. Employment among men | 14. Manufacturing > employment | 15. Marriage | 16. Divorce | 17. Out-of-wedlock births > | 18. Children living with two parents | 19. The class difference in > family trends | 20. Health insurance coverage | 21. Health care > spending and health outcomes | 22. Deaths among middle-aged whites | > 23. Deaths from prescription opioid overdose and heroin overdose | > 24. Obesity | 25. Household income stability | 26. Middle-class > income growth | 27. Middle-class income growth between cohorts and > within cohorts | 28. Subjective class position | 29. Government > transfers to households with low income | 30. Retirement income for > the elderly | 31. Social Security | 32. Affluence and religiosity | > 33. Religiosity | 34. Tolerance toward homosexuals | 35. LGBT > persons’ perceptions of social acceptance | 36. Hate crimes | 37. > Participation in voluntary organizations | 38. Labor unions | 39. > Income and happiness | 40. Happiness | 41. Loneliness among adults | > 42. Loneliness among teenagers | 43. Social support | 44. Suicides | > 45. Trust | 46. Homicides | 47. Violent crime | 48. War deaths | 49. > Terrorism killings | 50. Incarceration | 51. Peaceful transfer of > political power | 52. Americans haven’t moved away from the center > in their political views | 53. Americans’ political > representatives have moved away from the center | 54. Voter > participation | 55. Election-year economic performance and > presidential election outcomes | 56. The unrepresentative US Senate > | 57. Income and political influence | 58. Political gridlock | 59. > Income inequality | 60. Wealth inequality | 61. Many Americans > don’t like the idea of big government | 62. Most Americans like > the things government actually does | 63. Government revenues | 64. > Tax progressivity | 65. Taxation of the rich | 66. Government size > and government debt | 67. Government size and innovation | 68. > Government size and economic growth | 69. Government size and > personal liberty | 70. Inflation | 71. Migration | 72. Immigration | > 73. Views about immigration | 74. Trade | 75. Imports | 76. Military > spending | 77. Views on military intervention | 78. College > completion among women and men | 79. The gender pay gap | 80. Pay > among women and men | 81. Housework and child care by women and men > | 82. Women in politics | 83. Rape | 84. Racial-ethnic diversity | > 85. Life expectancy among African Americans and whites | 86. College > completion among African Americans and whites | 87. Wealth among > African Americans and whites | 88. Incarceration among African > Americans and whites | 89. Police killings of unarmed African > Americans and whites | 90. Whites’ embrace of African Americans | > 91. Abortions | 92. Views on abortion policy | 93. Marijuana policy > | 94. Views on marijuana policy | 95. State gun policy and gun > deaths | 96. Views on gun policy | 97. Leisure time | 98. Carbon > dioxide emissions | 99. Carbon dioxide concentration in the > atmosphere | 100. Earth’s average temperature Again, follow the link . AddThis Sharing Buttons Share to FacebookFacebookShare to TwitterTwitterShare to PrintPrintShare to EmailEmailShare to MoreAddThis4 Filed under Economics,
Political Science
,
Sociology
,
Statistical computing.
6 Comments
� Older Entries
*
Search for:
*
RECENT COMMENTS
* Sameera Daniels on “As a girl, she’d been very gullible, but she had always learned more thatway.”
* Dale Lehman on “As a girl, she’d been very gullible, but she had always learned more that way.” * “As a girl, she’d been very gullible, but she had always learned more that way.” « Statistical Modeling, Causal Inference,and Social Science
on Handy statistical lexicon * Anoneuoid on “Estimating Covid-19 prevalence using Singapore andTaiwan”
* DC on My best thoughts on priors * Justin on My best thoughts on priors * EHG on “Estimating Covid-19 prevalence using Singapore andTaiwan”
* Gowanus on “Estimating Covid-19 prevalence using Singapore andTaiwan”
* Rahul on Do these data suggest that UPS, Amazon, etc., should be quarantining packages? * Rahul on He’s annoyed that PNAS desk-rejected his article. * Martha (Smith) on Do these data suggest that UPS, Amazon, etc., should be quarantining packages? * Daniel Lakeland on Do these data suggest that UPS, Amazon, etc., should be quarantining packages? * Daniel Lakeland on Do these data suggest that UPS, Amazon, etc., should be quarantining packages? * Rahul on Do these data suggest that UPS, Amazon, etc., should be quarantining packages? * Anoneuoid on Do these data suggest that UPS, Amazon, etc., should be quarantining packages? * Daniel Lakeland on Do these data suggest that UPS, Amazon, etc., should be quarantining packages? * Anoneuoid on Do these data suggest that UPS, Amazon, etc., should be quarantining packages? * Anoneuoid on Do these data suggest that UPS, Amazon, etc., should be quarantining packages? * Chris Wilson on My best thoughts on priors * aok1425 on The New Yorker fiction podcast: how it’s great and how it could be improved*
CATEGORIES
* Administrative
* Art
* Bayesian Statistics* Causal Inference
* Decision Theory
* Economics
* Literature
* Miscellaneous Science * Miscellaneous Statistics * Multilevel Modeling* Political Science
* Public Health
* Sociology
* Sports
* Stan
* Statistical computing * Statistical graphics* Teaching
* Zombies
Powered by WordPress . Theme F2.
Details
3